
Football
Data Analysis: How Wisconsin Football Beat Illinois
Let’s go beyond the score to examine how Wisconsin football beat Illinois on Saturday.

Given the Badgers expectations coming into this season, this win gets things back under control for Wisconsin Football. The Badgers now control our destiny in the Big Ten West. We’ll see if that fact lives past our matchup with Ohio State next week.
This win showed us a lot about this Football Team and the Coaches at its helm. I thought Phil Longo in particular shined when we needed it most. His last three Scoring Drives were almost flawless!
Play Calls:
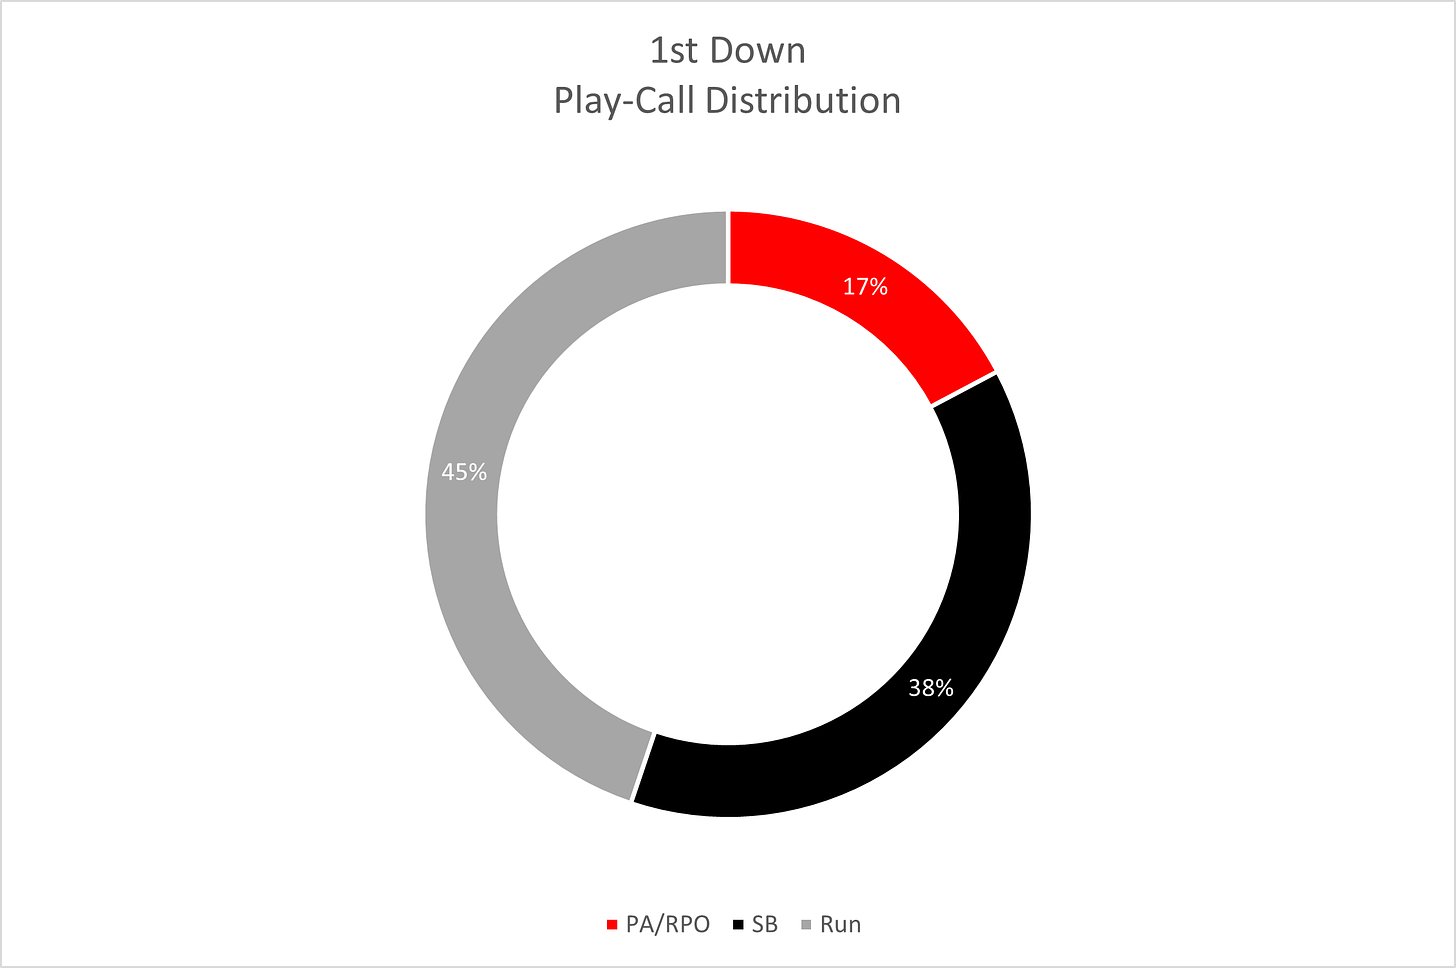
We saw an okay dose of PA/RPO Passes on 1st Down. I’d like to see more, especially with Illinois crashing so hard on the Read-Option. I’d like to see more H-Outs off of the TE motion. Or what I really loved was that Whip Route to Bryson Green on the 2nd to last drive.
That one came on 2nd Down. But if Locke isn’t going to be a threat to pull and run himself to counter those hard crashes, we need to supplement a bit more with those backside routes on all of our Read Options. This should increase our PA/RPO Pass % as Braedyn pulls and instead of using his feet like Mordecai, they’re short RPO Throws instead.
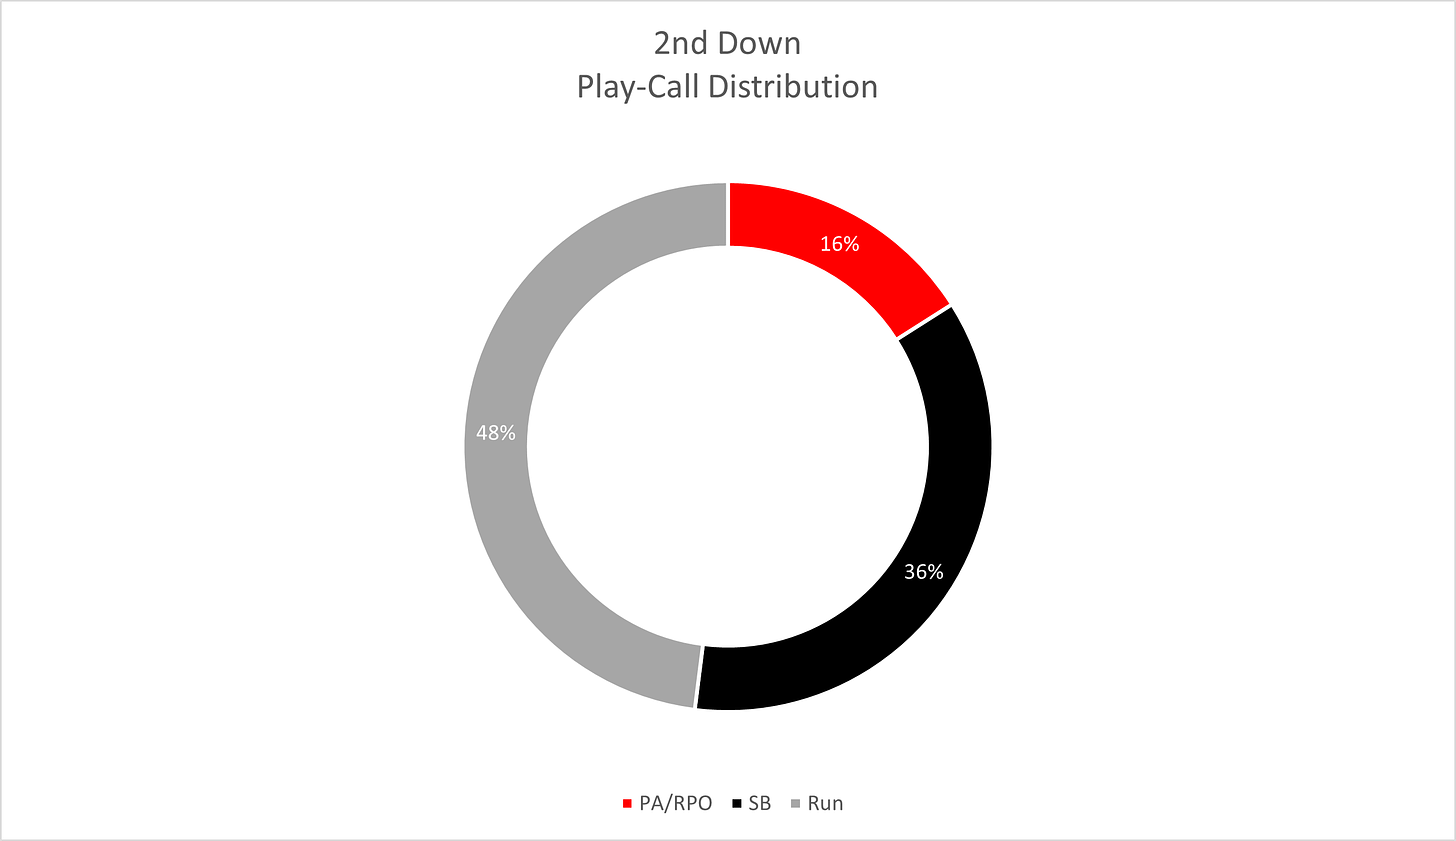
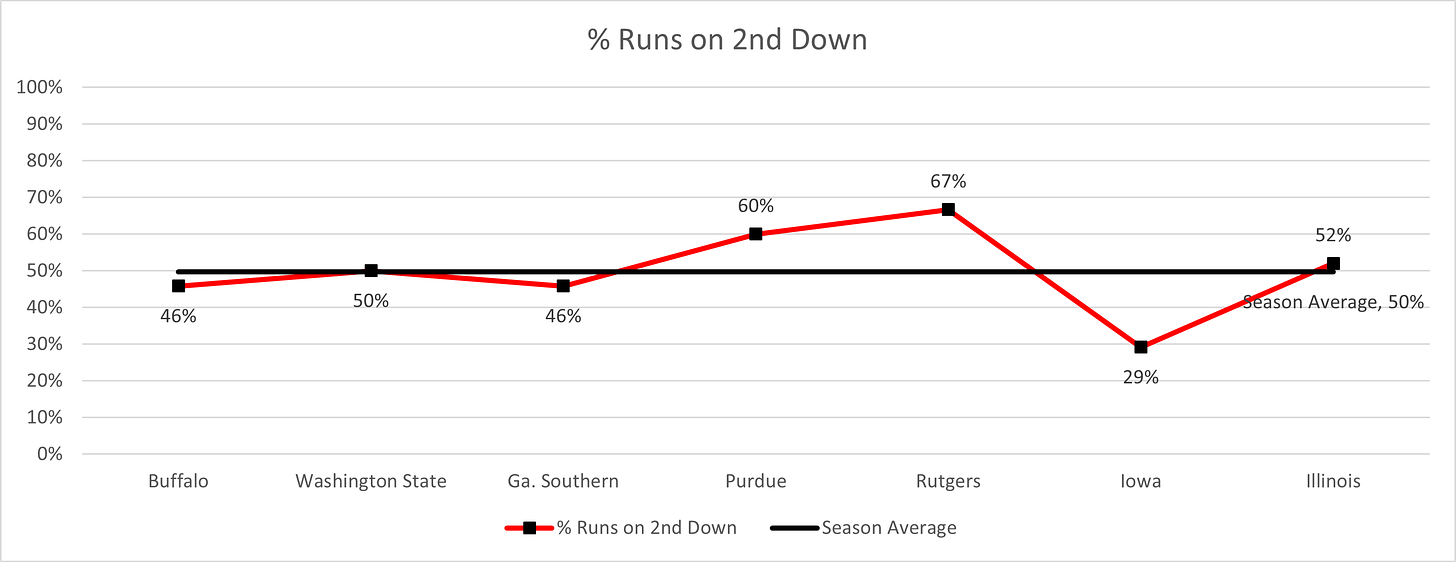
It’s a much different story than last week on 2nd Down. A much healthier dose of running plays. With 52% vs. 29% vs. Iowa:
Success Rate:
A new stat we’re tracking is Success Rate.
What is Success Rate? If you’re at all in tune with the NCAAF/NFL Analytics community, you’ve surely seen it. But what the hell does it mean???
Success Rate – much like EPA, is a metric designed to parse out the noise of YPA into a more thoughtful approach to Offensive or Defensive “Efficiency”.
A play is defined as “successful” if:
- 50% of the Yards-to-Go are achieved on 1st Down
- 70% of Yards-to-Go are achieved on 2nd Down
- 100% of Yards-to-Go are achieved on 3rd/4th Down
So…Success Rate is the number of plays where those parameters are achieved divided by the total offensive or defensive plays.
This cuts out the noise that EPA can generate on those “Explosive” Plays both Positive and Negative. And is more of a metric of Drive x Drive Efficiency regardless of Field Position.
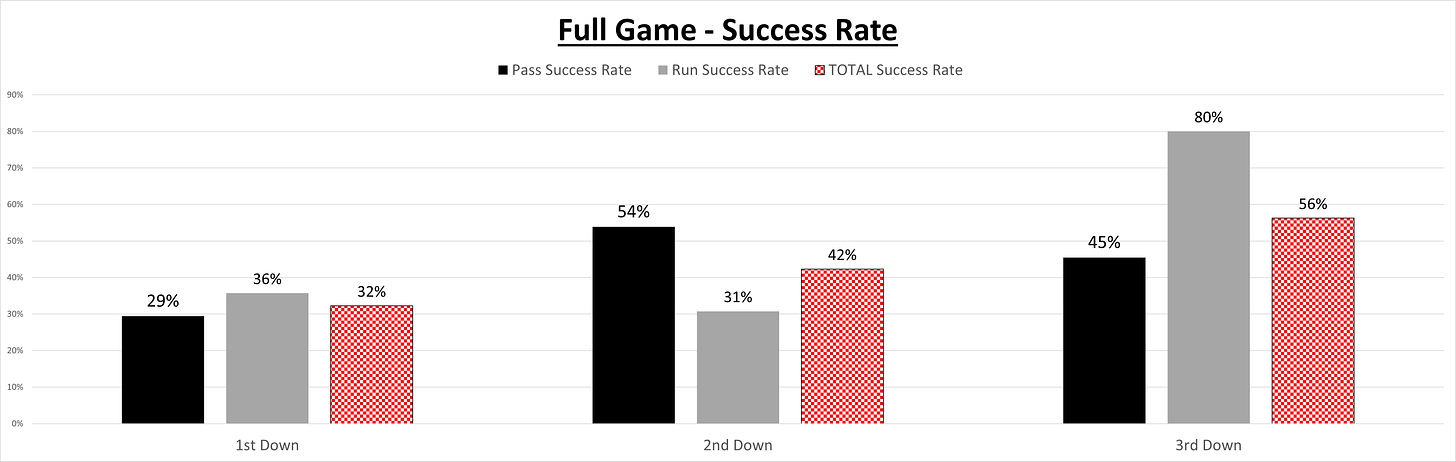
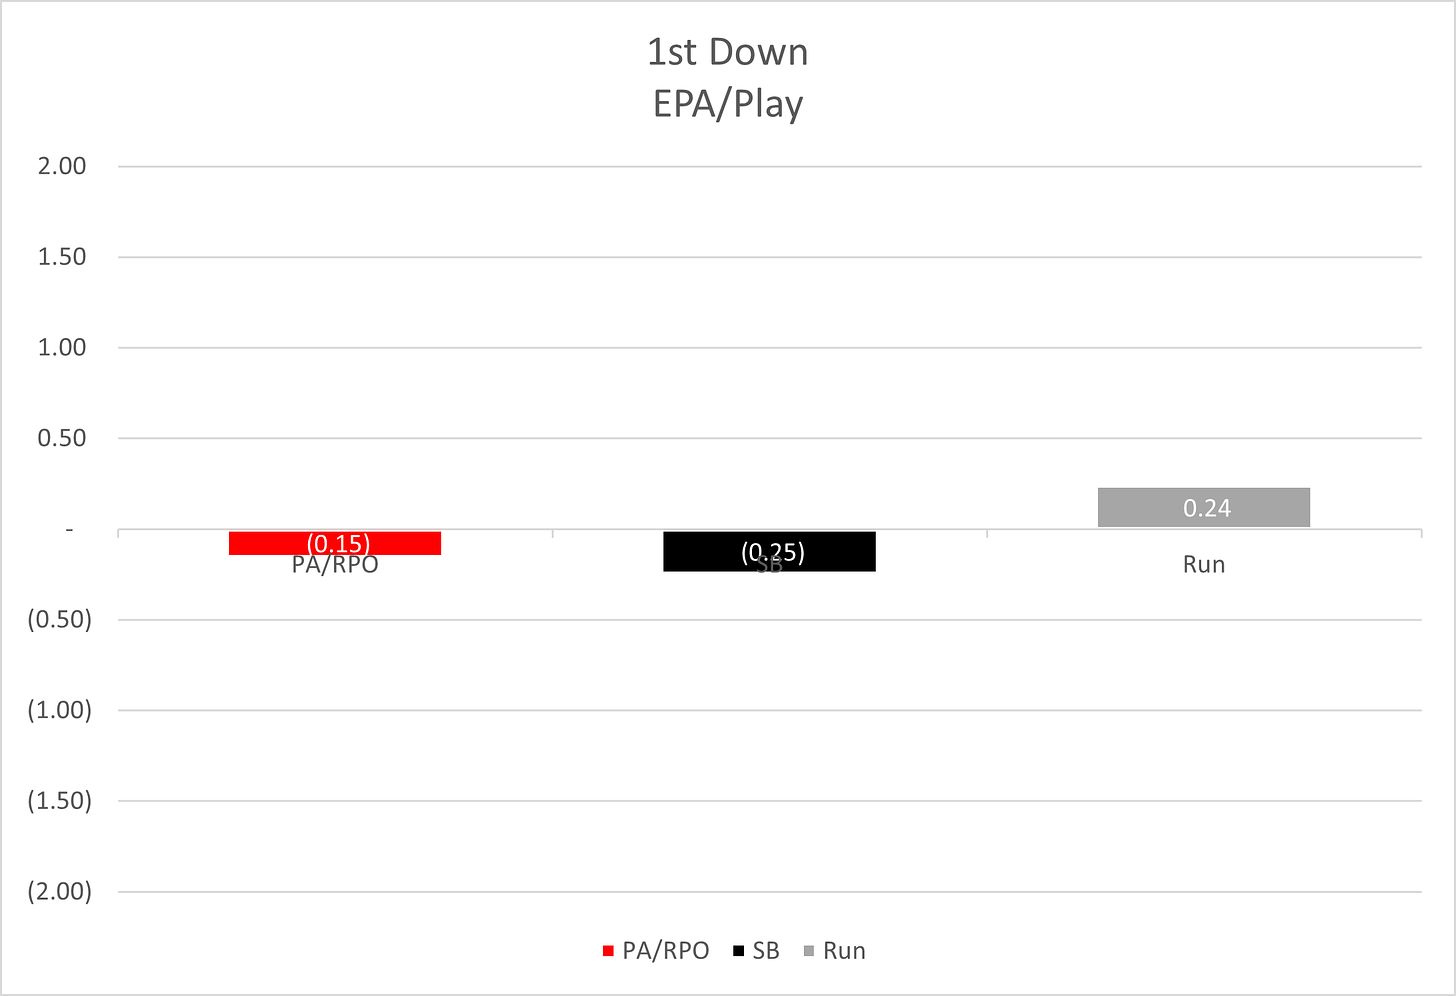
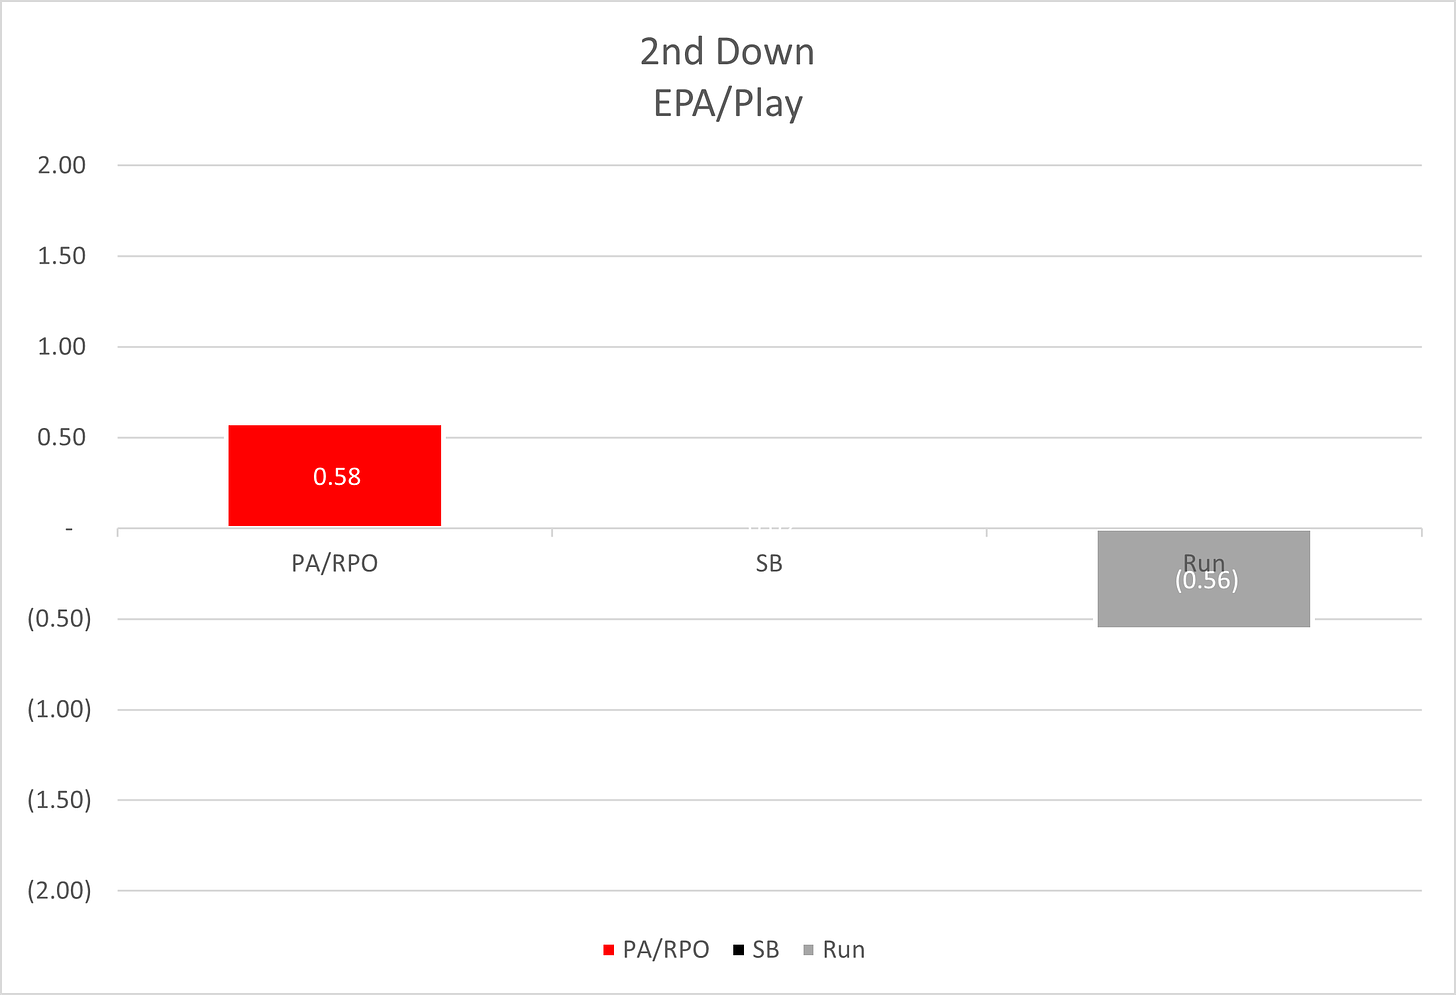
Wisconsin football saw a bit better Success Running the ball on 1st Down vs. Passing. On 2nd Down we saw MUCH more success Passing the ball vs. Running.
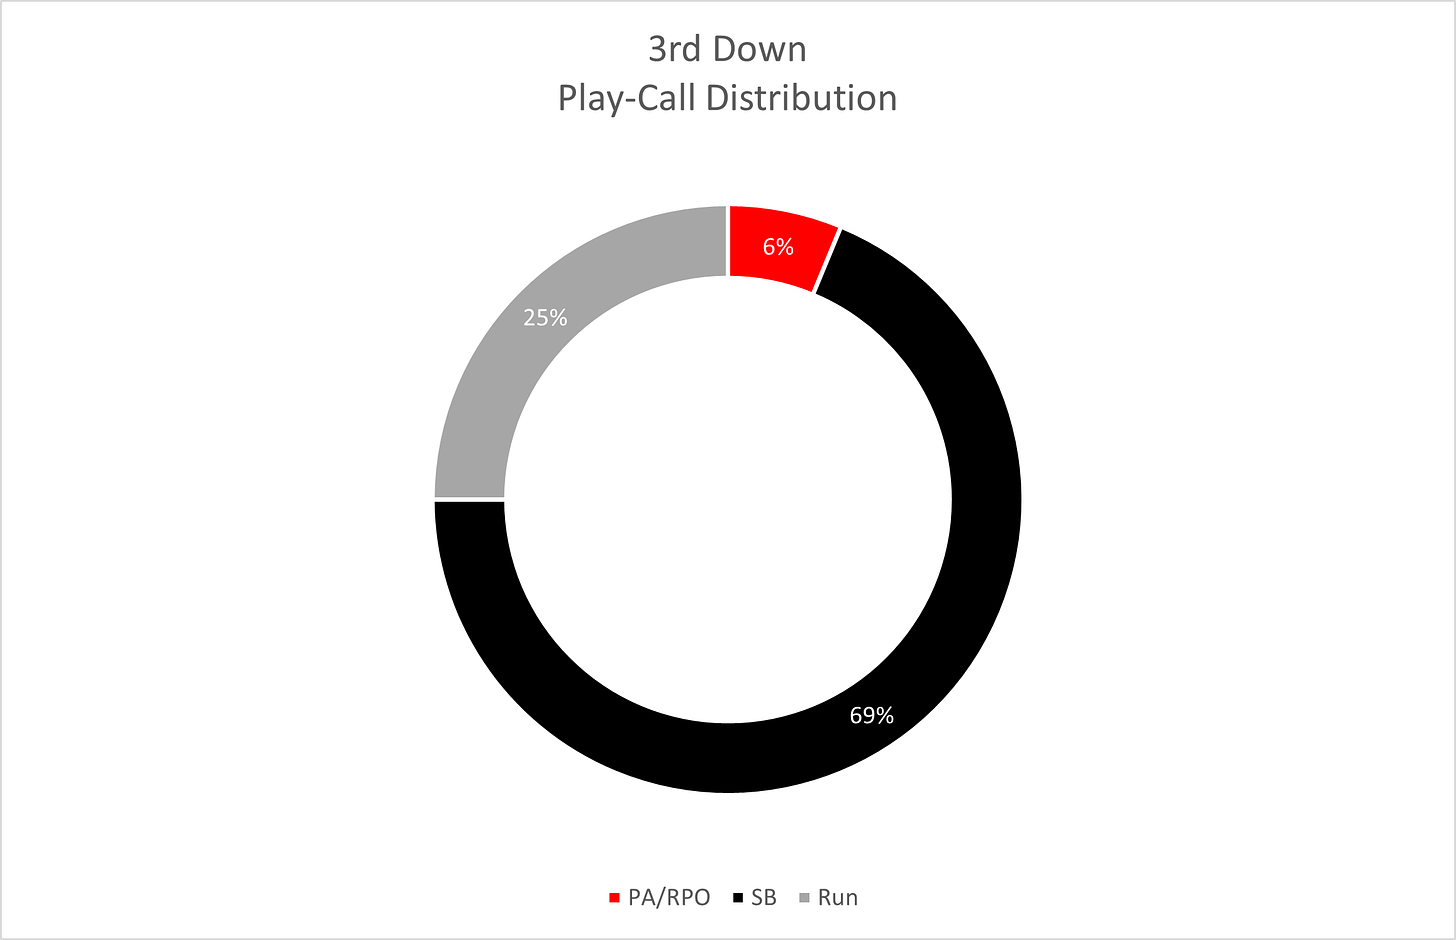
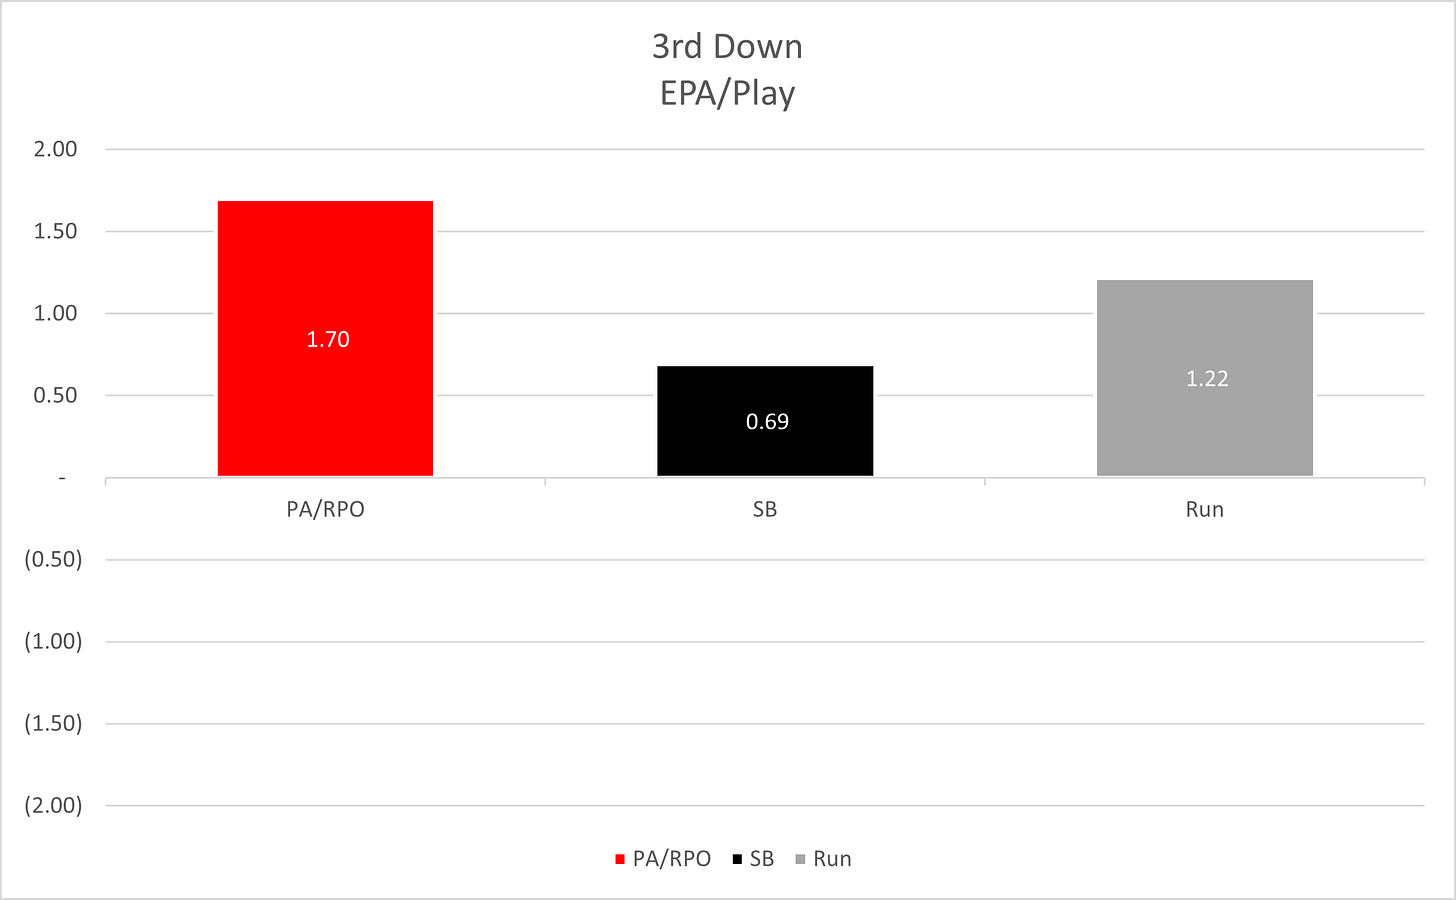
Then, Running the ball on 3rd Down was much more successful for Wisconsin.
The Badgers thrived on 3rd Down this year by maintaining a healthy dose of “Manageable” situations we can run in. Thankfully, we had a good dose of those Saturday (64%)!!
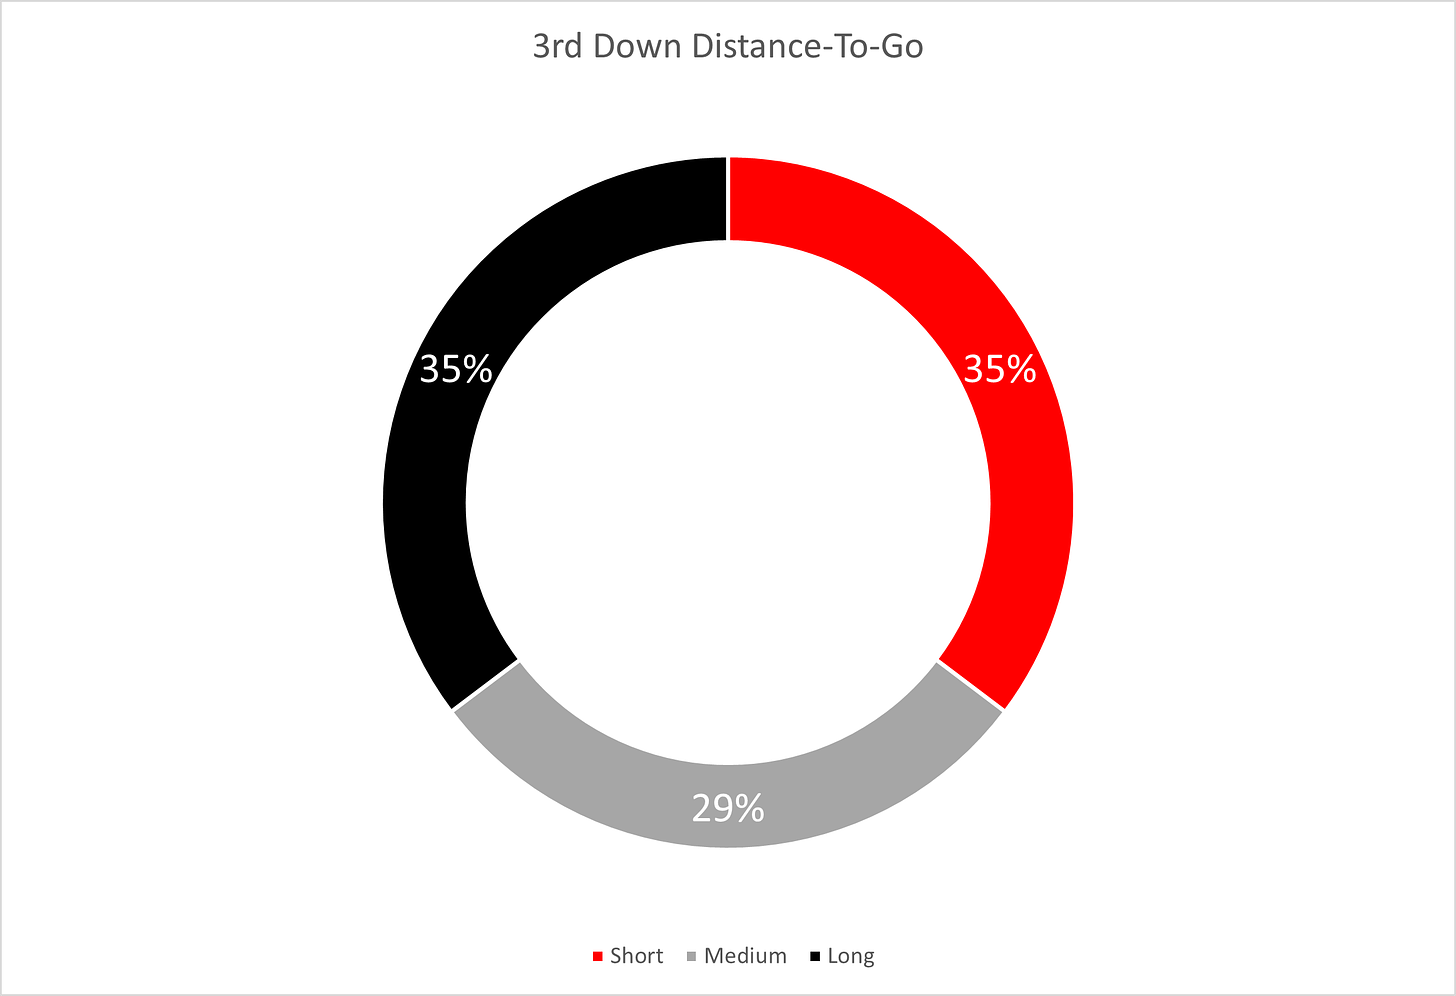
We had been seeing upwards of 80% of our 3rd Downs in a 3rd & Manageable (Medium & Short). So the 64% we saw on Saturday is still lagging behind our Season Performance.

But, even with higher levels of 3rd & “manageable” situations. Wisconsin football still dropped the ball with our Run v. Pass Mix IMO:
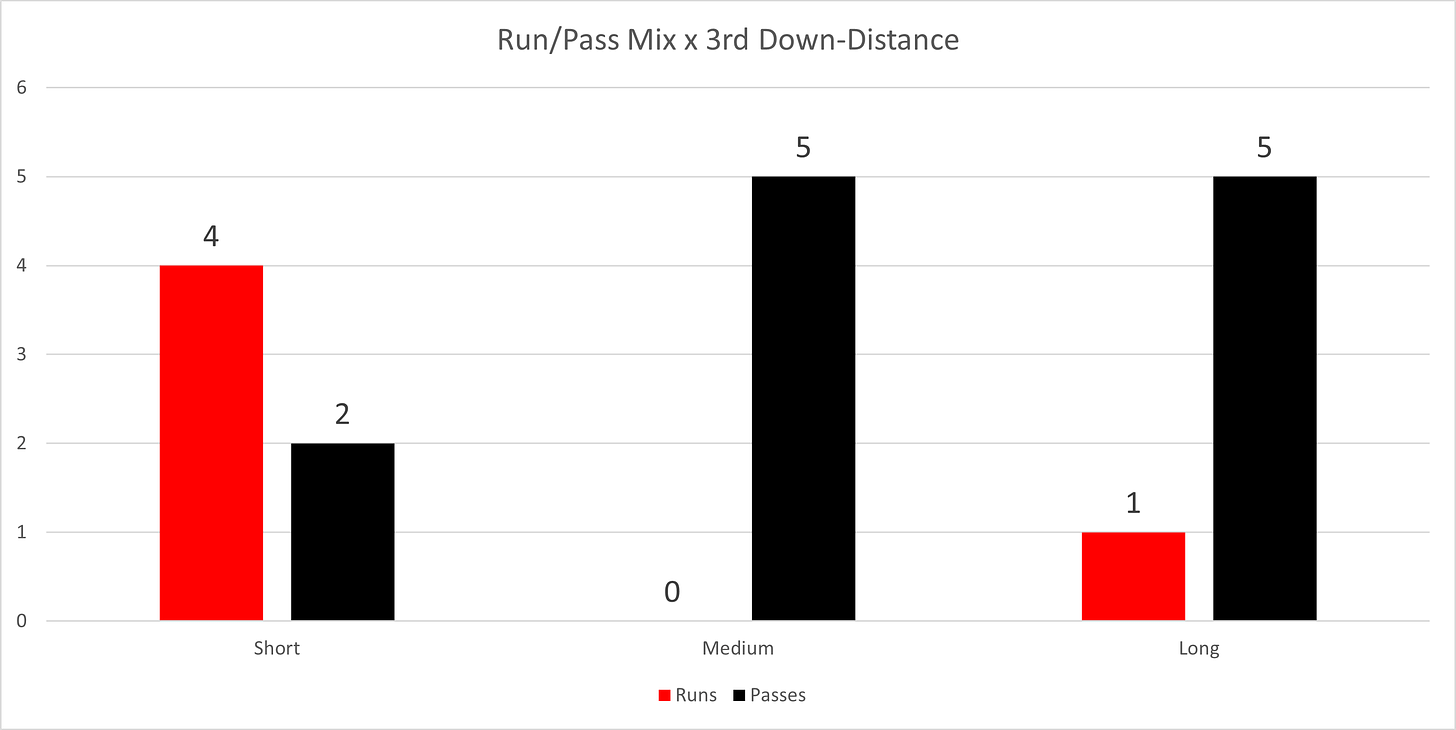
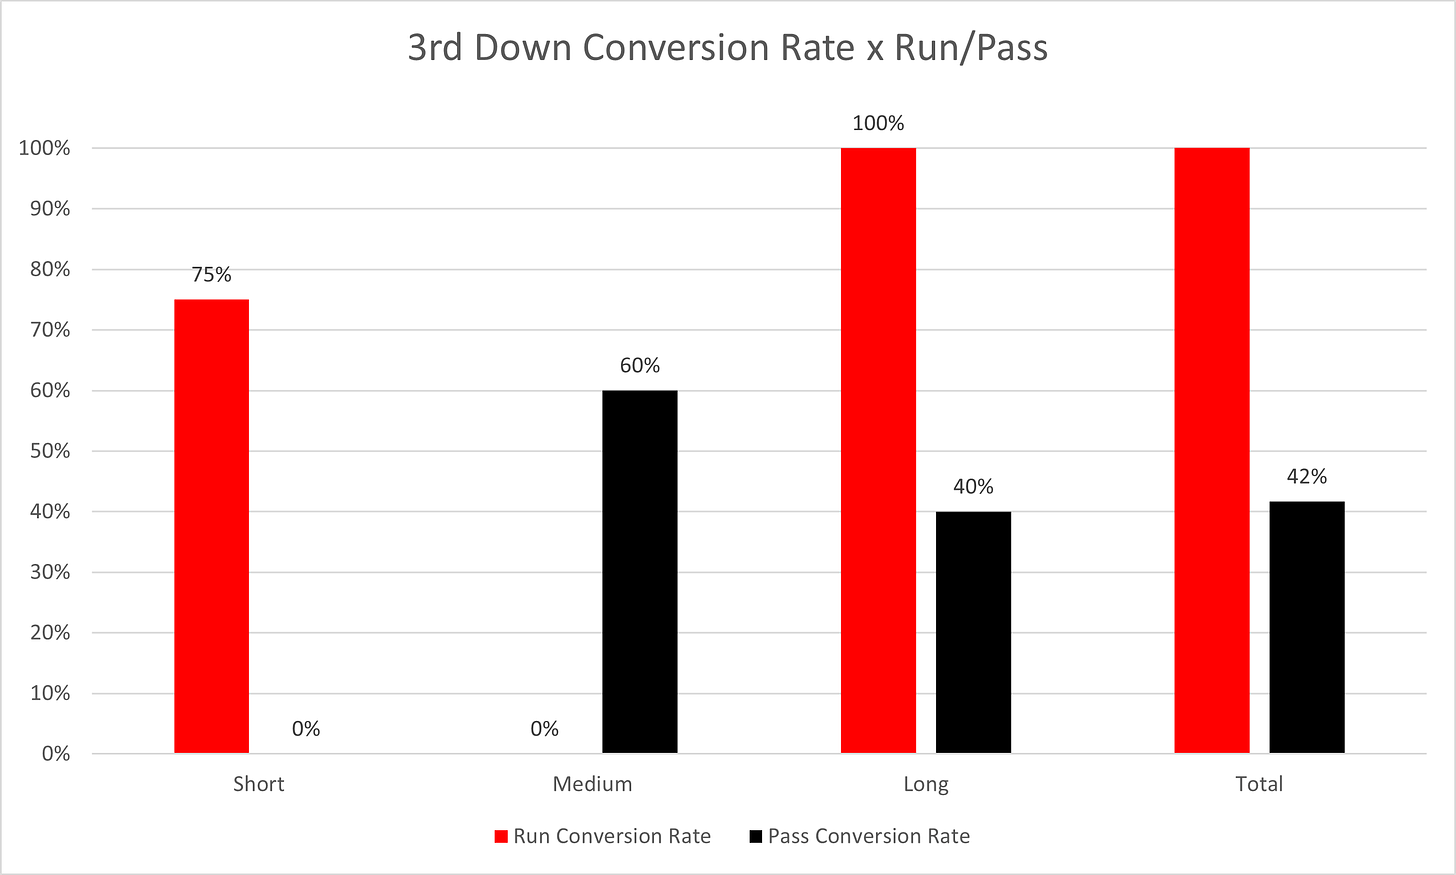
In 3rd & Shorts, we went Pass in 33% of those situations!!! With a Conversion Rate of 0%…
I’d be fine with those if they weren’t Straight DBs…might be anecdotal based on these results, but if you’re going to pass there, I’d like it to be a PA/RPO. Those quick mesh/crossing routes are tough to time out without that extra half-second the play-fake gives the QB and WR to create more separation!
This severely impacted the Badgers 3rd & Short + Overall Conversion Rates:
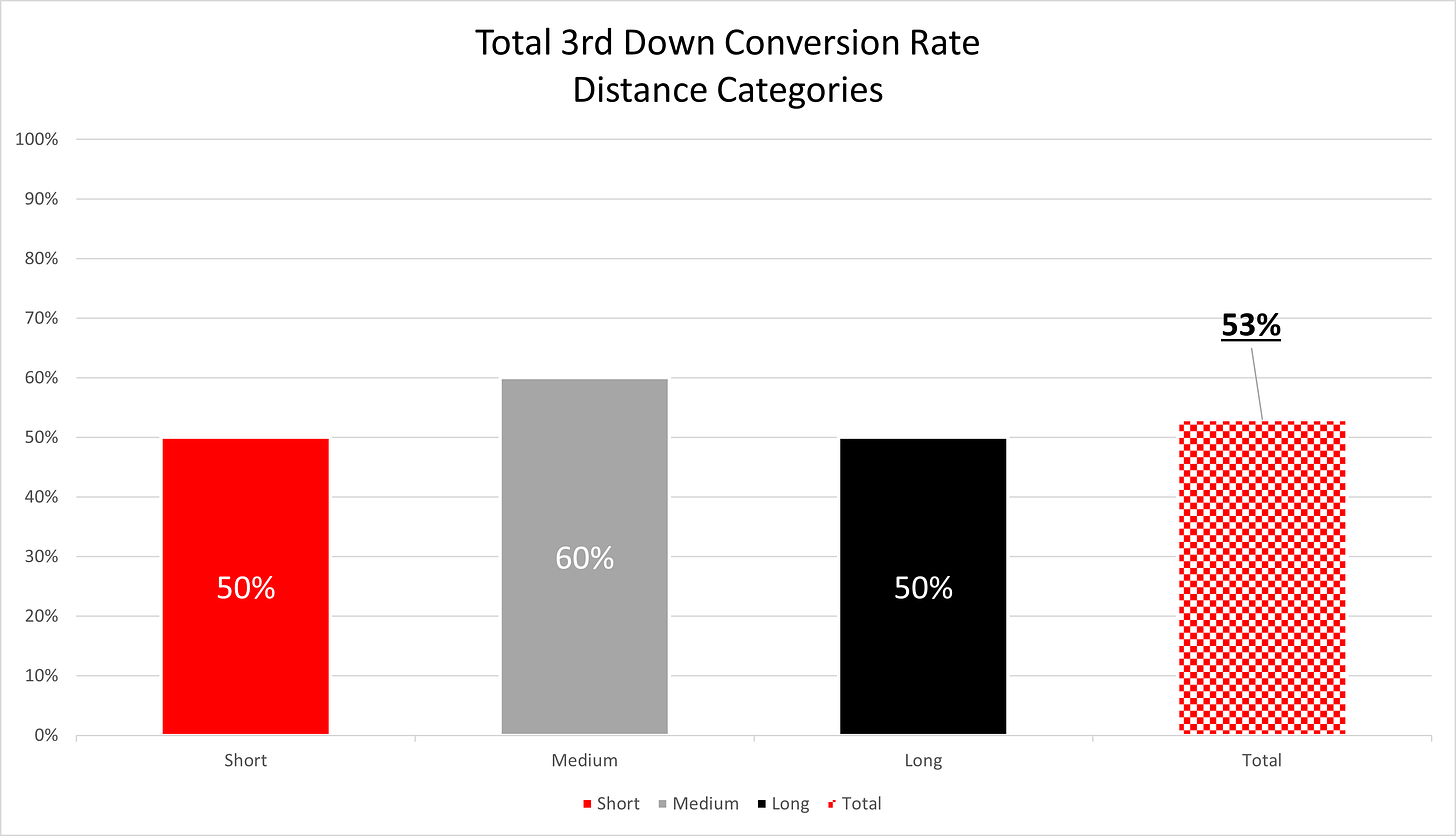
Much improved performance, but could’ve been a bit better as well.
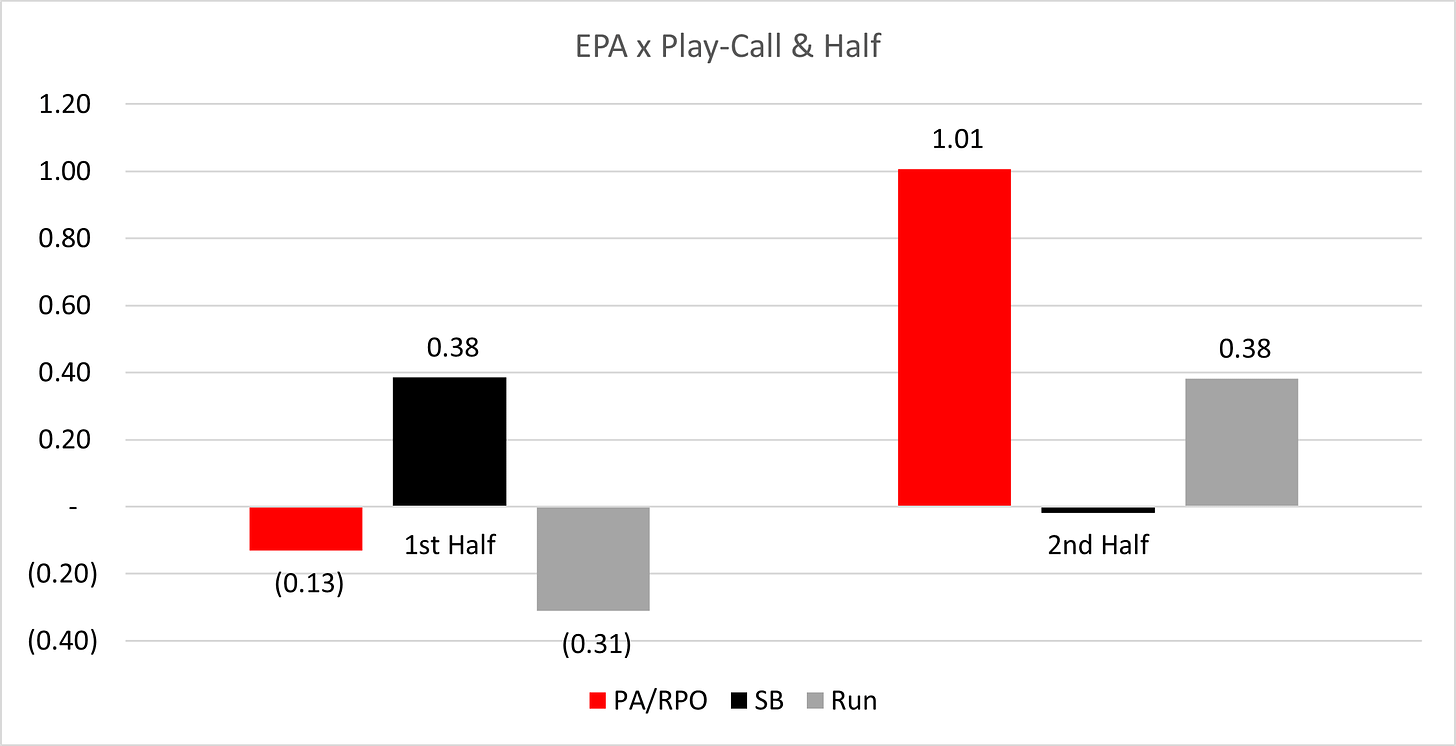
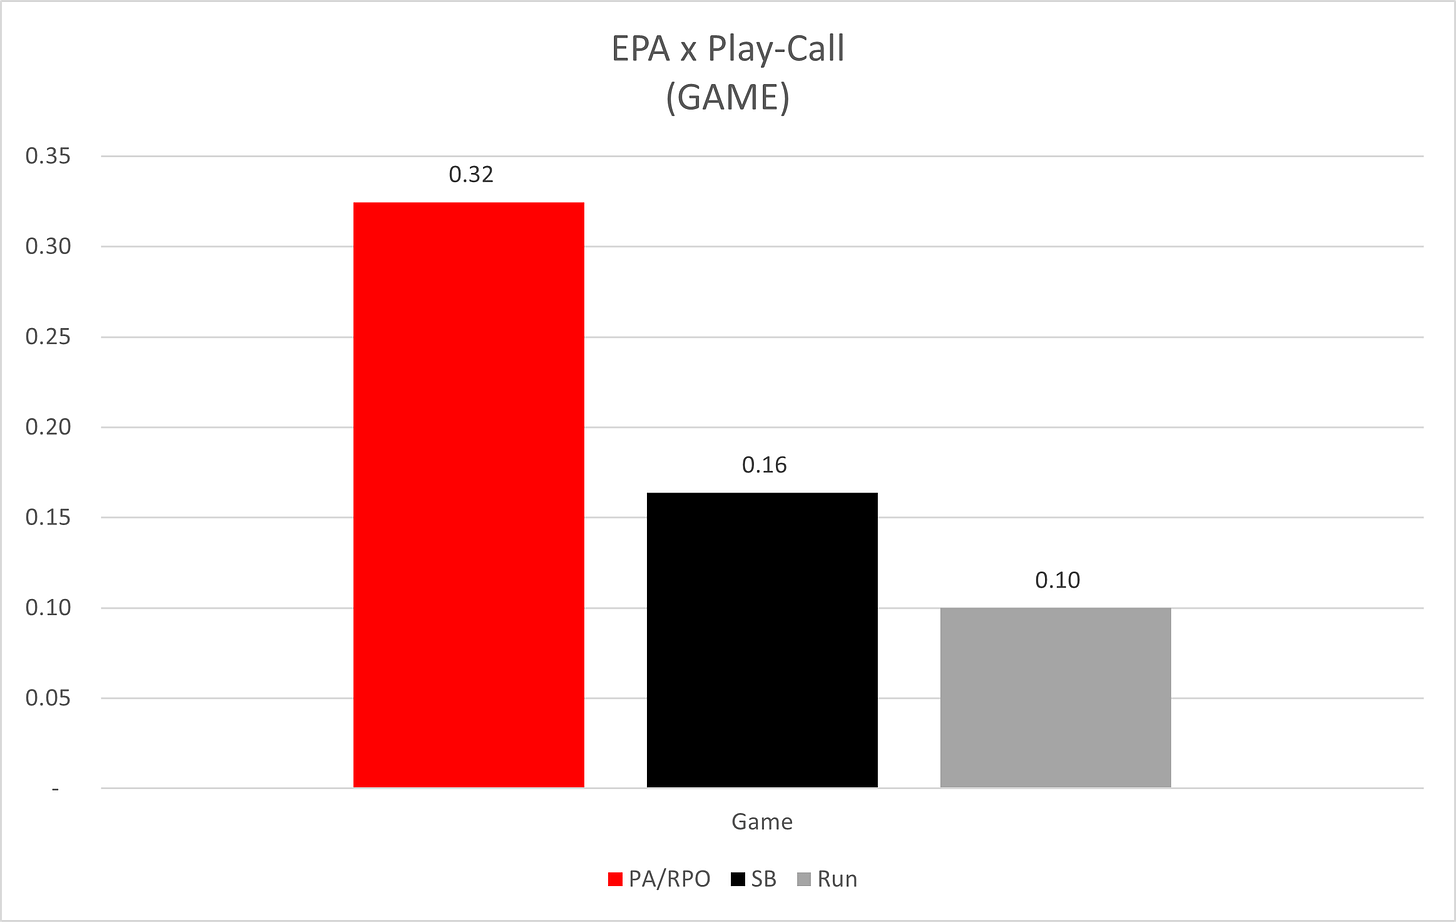
EPA:
EPA/Play x Half & Game:
Wisconsin Football EPA Leaders:
Braedyn Locke (Passing):
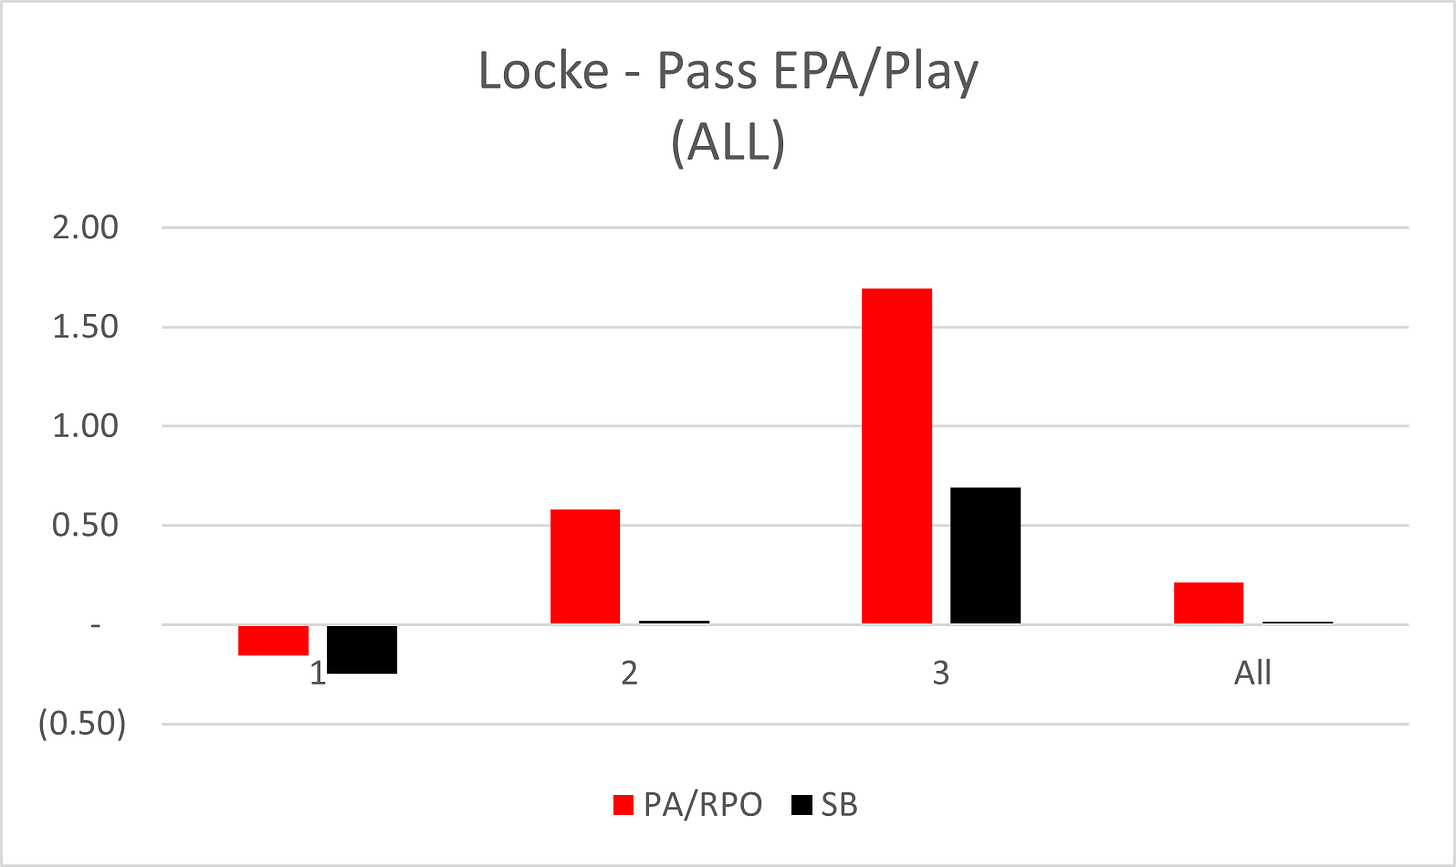
Baller!
Some struggles on 1st Down from an EPA standpoint. But man he really shined on 2nd & 3rd Down, which is where we saw most of our Passing occur! That 3rd Down PA/RPO EPA is all on the final offensive play of the game.
There were plenty of catchable balls out there too!
Based on SiS DataHub, about 29 of his 41 Passes were “Catchable”. That equates to a 70% Catchable Ball Rate and a -20% difference to his COMP % at 50%.
For context, the “Average” difference between Catchable Rate vs. COMP% is about -15% on 41 Passes that’s an extra 2 Completions. I’d say there were even a few more out there with easily 3-4 drops, a continual issue as this season progresses.
KEEP LOCKE CLEAN:
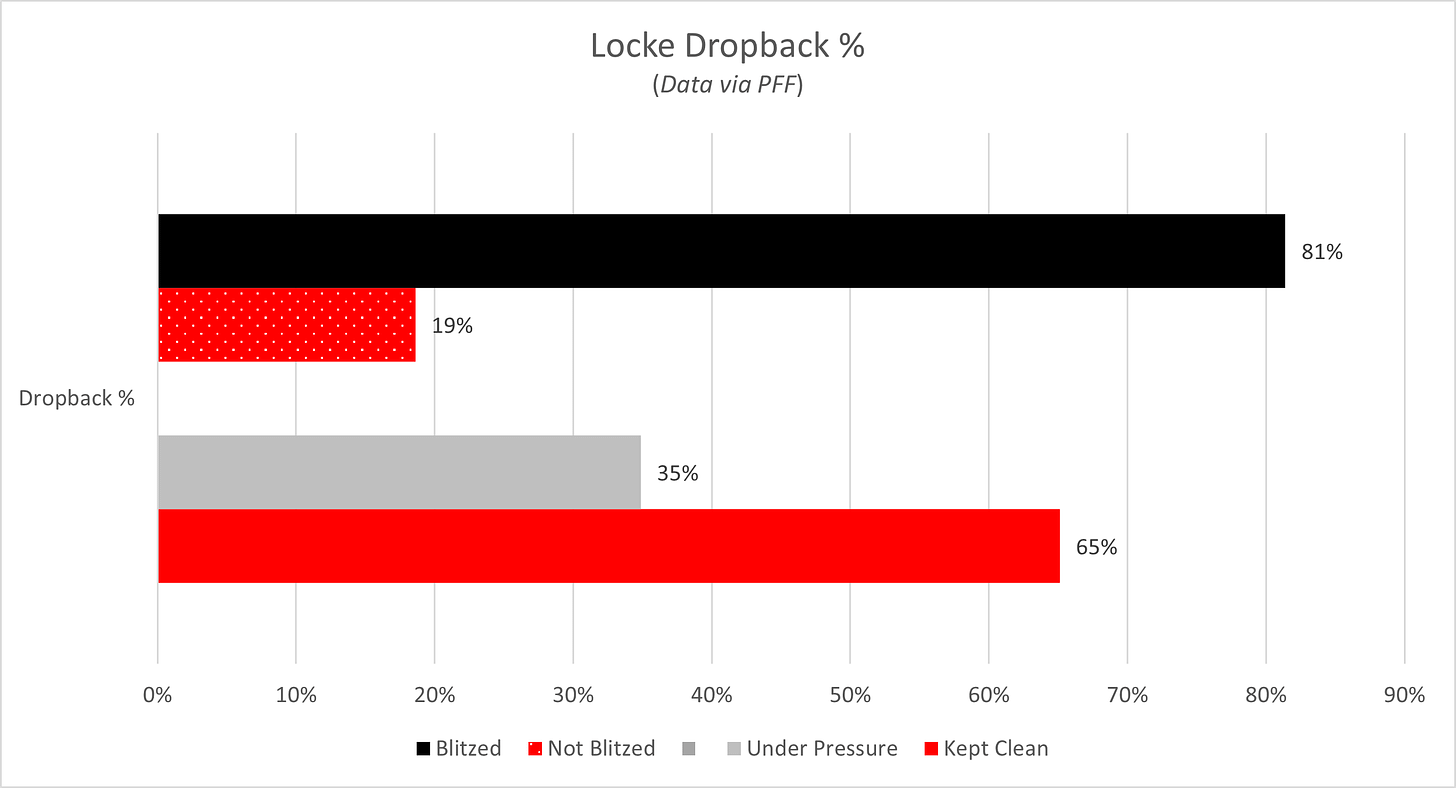
Locke was Blitzed on 81% of his Dropbacks. As you’ll see that is an EXTREMELY high number. Is that based on what they saw vs. Iowa from him or our O-Line?
Regardless, when Locke wasn’t Blitzed, he SHREDED Illinois with 11.13 YPA (data via PFF).
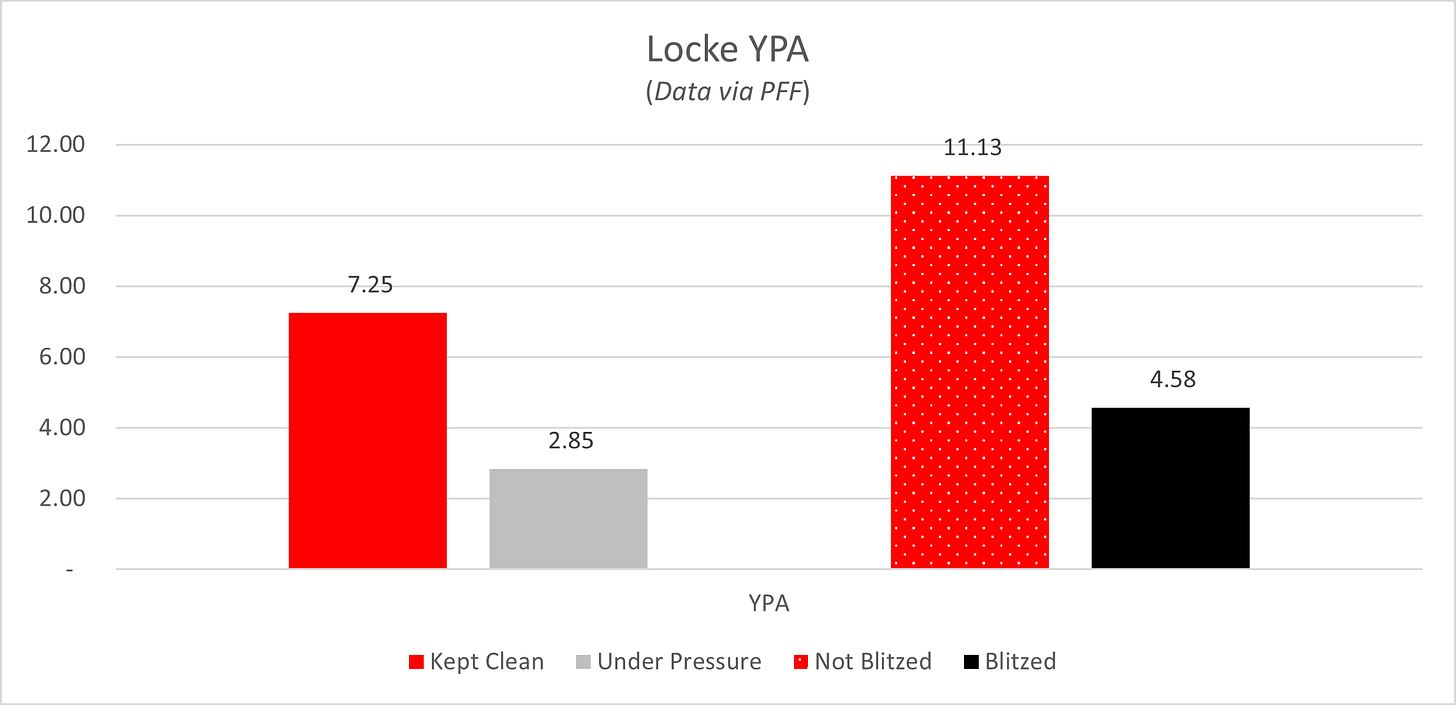
But if you kept him clean on those blitzes, he was still able to get you 7.25 YPA. That’s plenty good enough to get the job done!
Especially with how well Badgers running back Braelon Allen has been running the football. The problem was he was only kept clean on 65% of his Dropbacks.
Again, for context on QBs with >50 Dropbacks:
- FBS Average: 69.15%
- 75th Percentile: 73.8%
- Wisconsin Pre-Illinois: 75.1%
- 95th Percentile: 78.3%
If we can keep Locke as clean as we kept Mordecai, we’ll watch him sling it around the field! If not, he’s a RS-Freshman. He’s going to make mistakes in those situations! The ownership falls on the O-Line and Longo.
In particular, it was Huber, Furtney, and Mahlman who struggled with the Illinois D-Line yesterday:
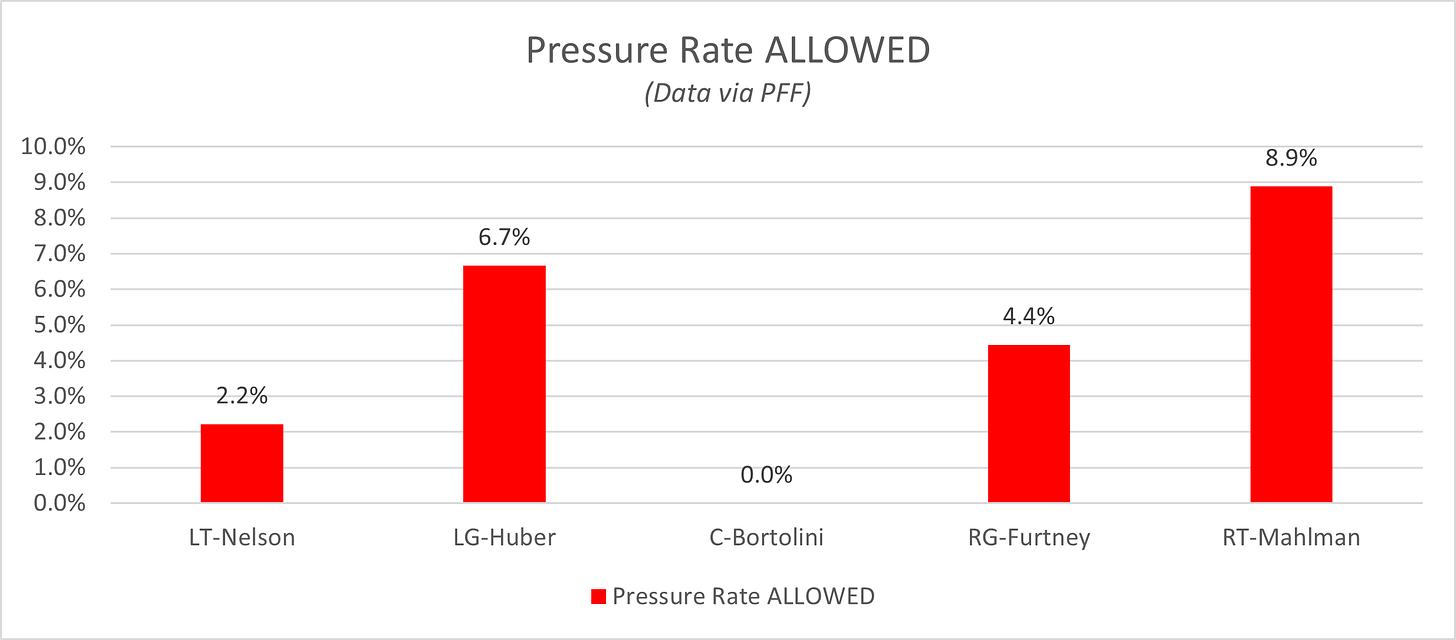
In general the Offense and the Wisconsin football O-Line is just really struggling vs. the Blitz. Not in the sense that they allow more pressure on Blitzes, but Teams are Blitzing us at a much higher rate.
About 8% more (44% vs. 36%)! And on Saturday, an absurd 81% of Drop-backs we faced a blitz. If this continues to be a trend, the Badgers need much more options in the quick game.
Rushing/Receiving EPA Leaders:
First, let’s take a look at the number of touches/targets by each player!
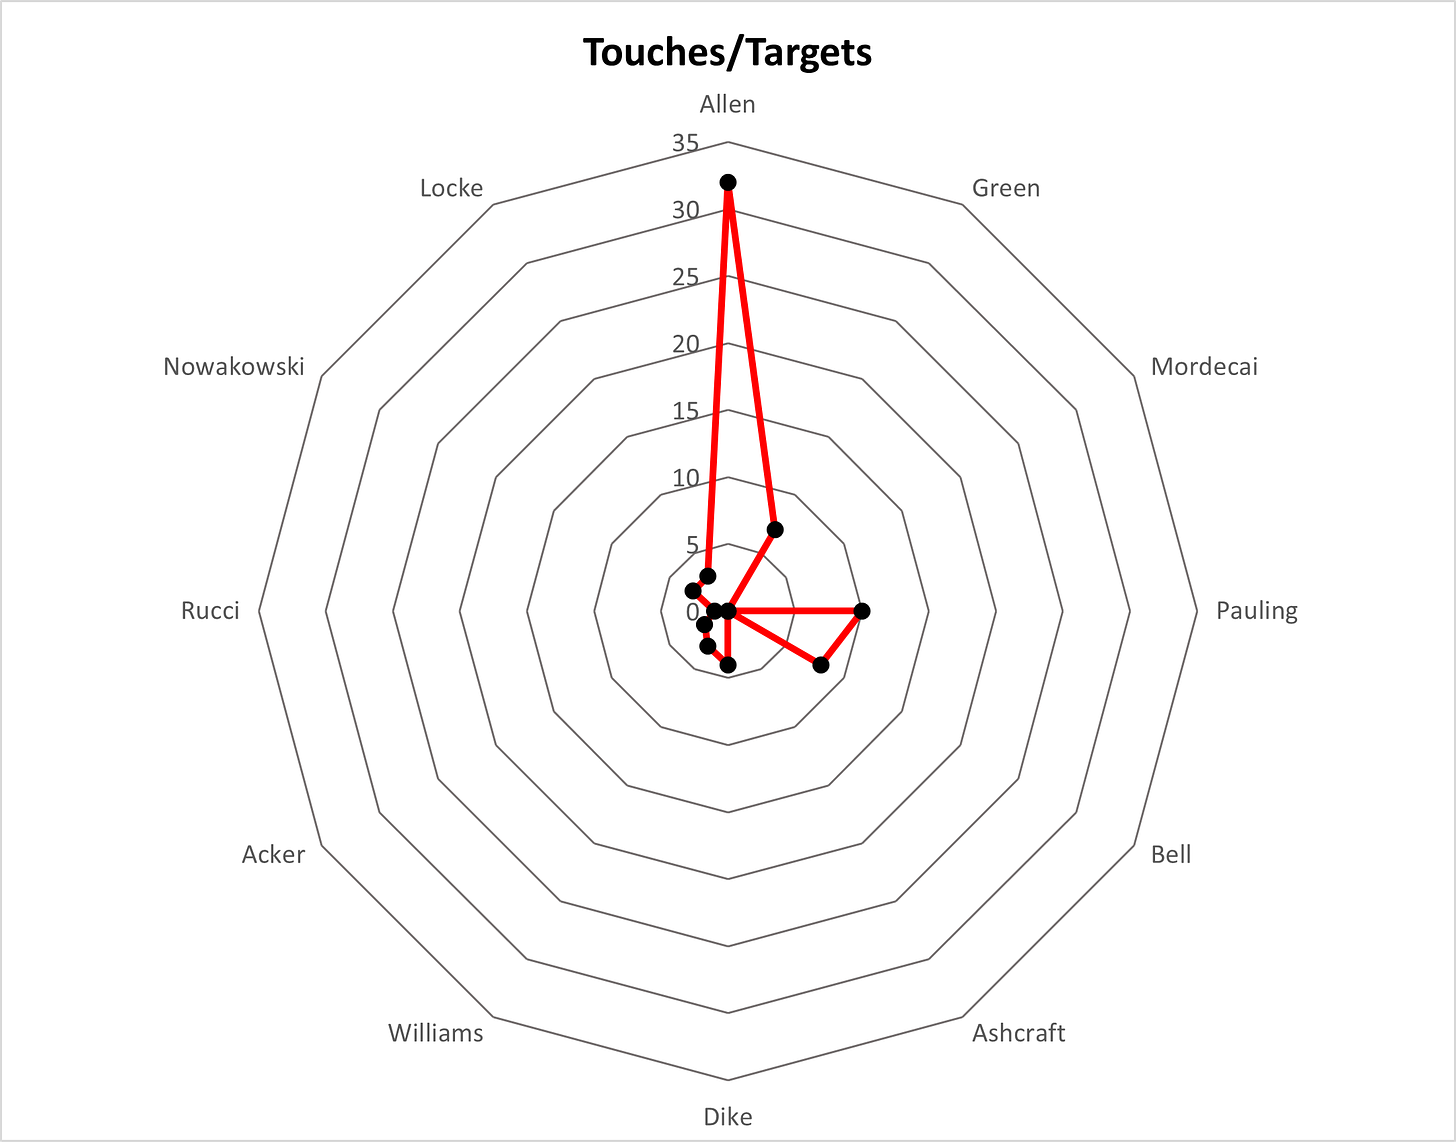
It’s the Braelon Show. 43% USG…PUT THE TEAM ON HIS BACK
Will Pauling and Skyler Bell both did their parts as well. Pauling is also that DUDE.
But I’m super happy for Skyler Bell and his Slot Fade, Braedyn sure did drop it in the bucket but that hasn’t always equated to a big play for Bell this year. He hauled it in and he had many other good catches on the night.
EPA Totals x Player:
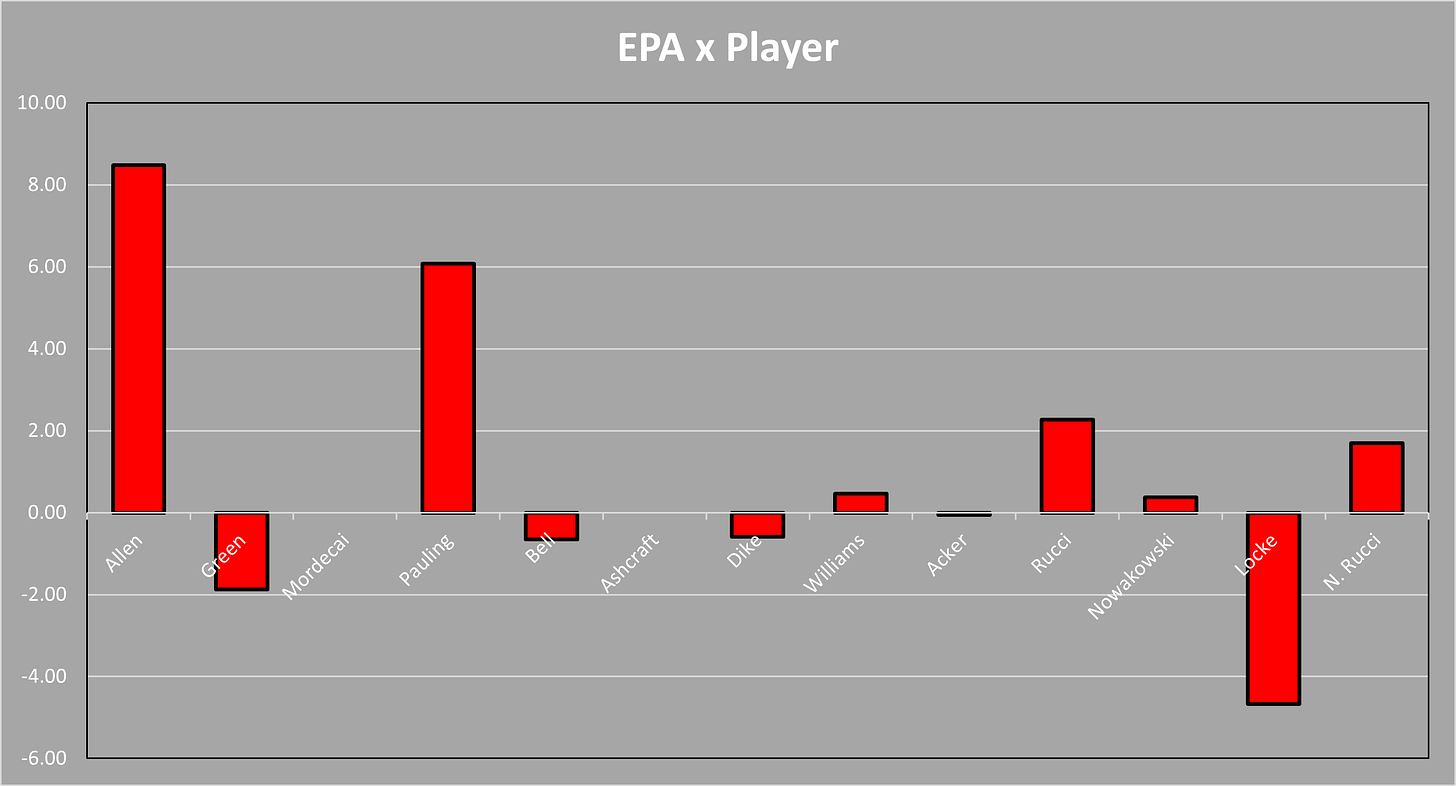
- Braelon Allen – A MONSTER game
- Will Pauling – Ballplayer: 10 Targets | 2nd Highest Total EPA
- RUCCI BROTHERS – Hayden also had a big-time grab early. Let’s not forget it! But little brother made the play of the day.
EPA/Play x Player:
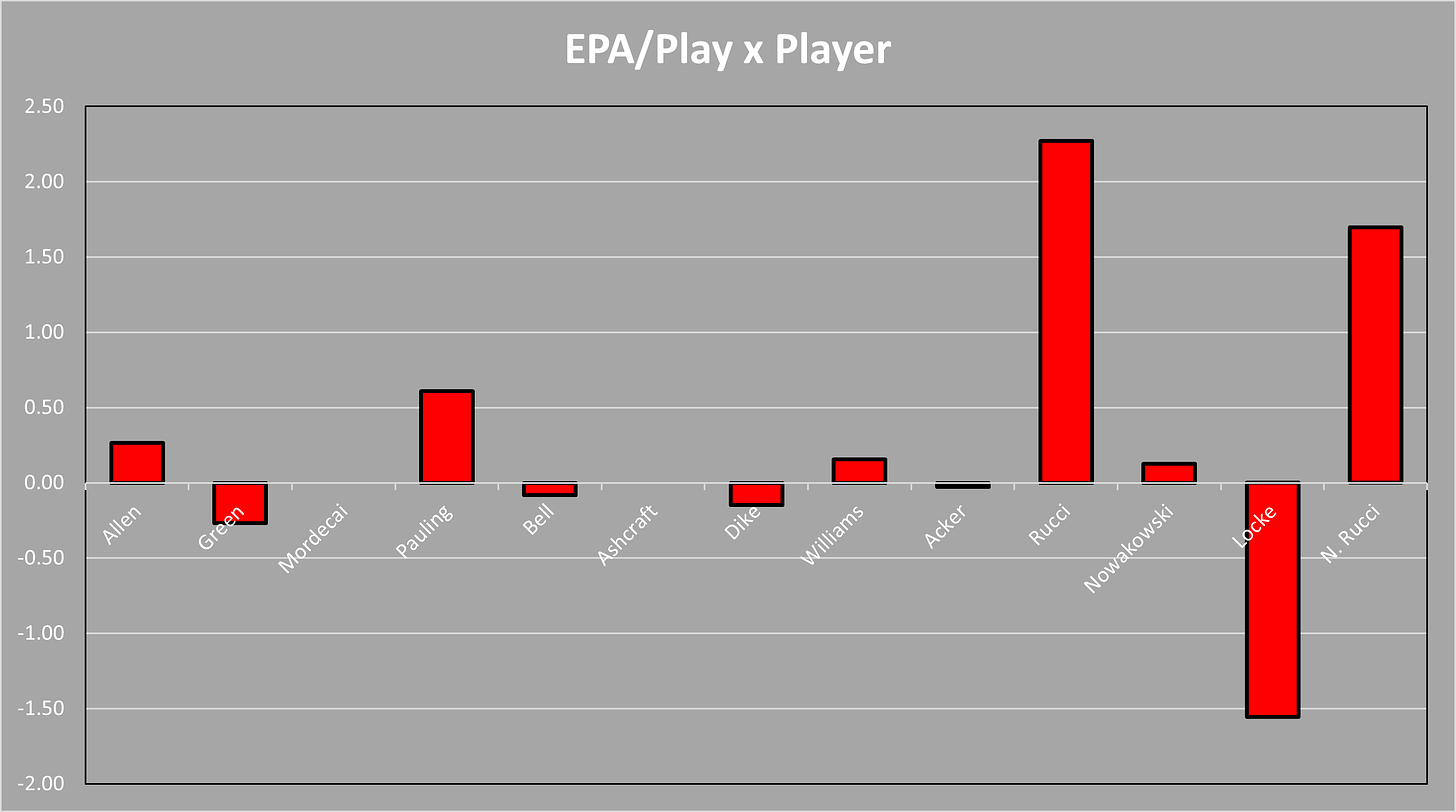
Rucci Brothers made some extremely impactful plays. But look at Pauling and Allen’s positive impact on 42 Touches/Targets. Incredible.
The Badgers Defense:
We’ve got one issue. Beyond that this group is really solid.
UW Defense vs. Illinois – Run Game:
UW had a 13% Stuff Rate against Illinois, a 7% reduction from Iowa.
What killed UW was allowing Luke Altmeyer to run roughshod over us all game. It wasn’t one particular area where he killed us. It came in the Zone Read & Scrambles.
Our inability at the ILB/OLB Position to make tackles in space allowed him to hurt us with his feet so badly. That is and has been one of the biggest issues for us. Not sure how many mobile QBs we’ll face down the stretch, but given how Cam Ward and now Luke Altmeyer feasted on our LBs. We should be on notice for any other mobile QBs…
Final Thoughts on Wisconsin Football vs. Illinois:
– Keep Locke Clean
Braedyn Locke is a baller when he’s given time and a clean pocket. Whatever we have to do to keep him clean we need to do it! Whether that’s more hot routes he can alert to when he senses a blitz or holding the H/TE and RB in to max protect.
If teams are going to pin their ears back and come after him, as we saw vs. Illinois at almost absurd rates. We need a better plan in place so the dropoff in performance isn’t so drastic.
– Our LB Core Concerns Me
Our Biggest Strength over the past 15 years has become one of our biggest weaknesses. Our Pressure Rates are fine, but our Sack-Pressure Rates are really low. What that means is our pressure really doesn’t have much of an impact on the QB. We lack the actual play-making ability.
On top of that, our Run Fits and Open Field Tackling are noticeably bad. And I think it’s a personnel gap. They are a step slow and really struggle with change of direction. It’s most noticeable at the ILB position.
I think this is the biggest gap between what this Staff wants and is coaching to and our player’s ability to perform that ask.
And it shows. It’s our 2nd worst Run Defensive Team since 2016. 2018 is #1
2nd Highest EPA Allowed/Run: -.096 EPA
2nd Highest Positive Play Rate Allowed: 40.2%
Highest BOOM Rate Allowed: 15.1%
3rd Highest Broken/Missed Tackle Rate: 12.2%
It was truly a great win on Saturday. Not based on our play, which has A LOT of room for growth. But based on our grit and poise. It would have been easy to fold up shop after going down 21-7.
But they didn’t…
The Offense strung three Straight Double-Digit Play Scoring Drives together, with the final two being 80+ Yard TD Drives. The defense was able to get off the field and keep them out of the EZ on three straight drives.
Complementary Football, and maybe the best we’ve seen at the most necessary time all Season. Hopefully, Wisconsin football will take that into next Week’s matchup vs. Ohio State and make that one a bit more nervy than the Buckeyes want.
As always…On Wisconsin!
Thank you for taking time out of your busy day to read our work at BadgerNotes.com. For more Wisconsin Badgers Athletics and Big Ten content, follow us on Twitter & Facebook. You can also subscribe to our YouTube Channel. You can also follow me on Twitter @GardYourFickell
Also, be sure to check out our shop, subscribe to our newsletter, and the BadgerNotes After Dark podcast, which is available on Apple Podcasts, Spotify, and all other streaming platforms. Because of your support, we have become one of the fastest-growing independent media outlets focused on giving a voice to the fans!


Wisconsin Football Transfer Receiver Commits to Eastern Michigan

Wisconsin Football Quarterback Room’s Post Spring Outlook

Wisconsin Badgers Bringing in Stephen F. Austin Transfer for Visit

Former Wisconsin Basketball Star Frank Kaminsky Inks New Deal

Wisconsin Football Student Section Was Embarrassing vs. Ohio State

Paul Chryst Emerging as Top Target for Big Ten Coaching Vacancy
-

 FB Recruiting1 day ago
Wisconsin Football Making Moves to Flip 4-Star Michigan Commit
-

 FB Recruiting3 days ago
Wisconsin Football: 2025 Running Back Target Re-Opens Recruitment
-

 Basketball4 days ago
Wisconsin Basketball Hiring Saint Leo Head Coach as Assistant
-

 FB Recruiting3 days ago
Wisconsin Football: 2025 WR Cameron Miller Commits to Badgers
