We’re still waiting for complete and utter dominance from the Wisconsin Badgers Football team in 2023.
Given the expectations coming into this season, the lack of that dominating performance start-finish is concerning without a doubt. Especially given their weak schedule to this point, and even more so given they have their toughest test since Week 2 with Iowa coming to Camp Randall next week!
But as you’ll see, this Badgers team is missing just ONE piece to the puzzle, and if we can find it…this team will run the table in the Big Ten West and find itself in Indy. With a chance to get a NY6 Bowl Berth!!! OR BETTER!!!
With that, I’ll get into the game “Beyond the Score” giving you rich insights and analytics that drive our performance.
If you’re looking for even more detailed Analytics, check out my “DEEP DIVE” series, where I dive into Player-Tracking Data and more!!
Alright, let’s jump into it!!
Play Calling Distribution & EPA:
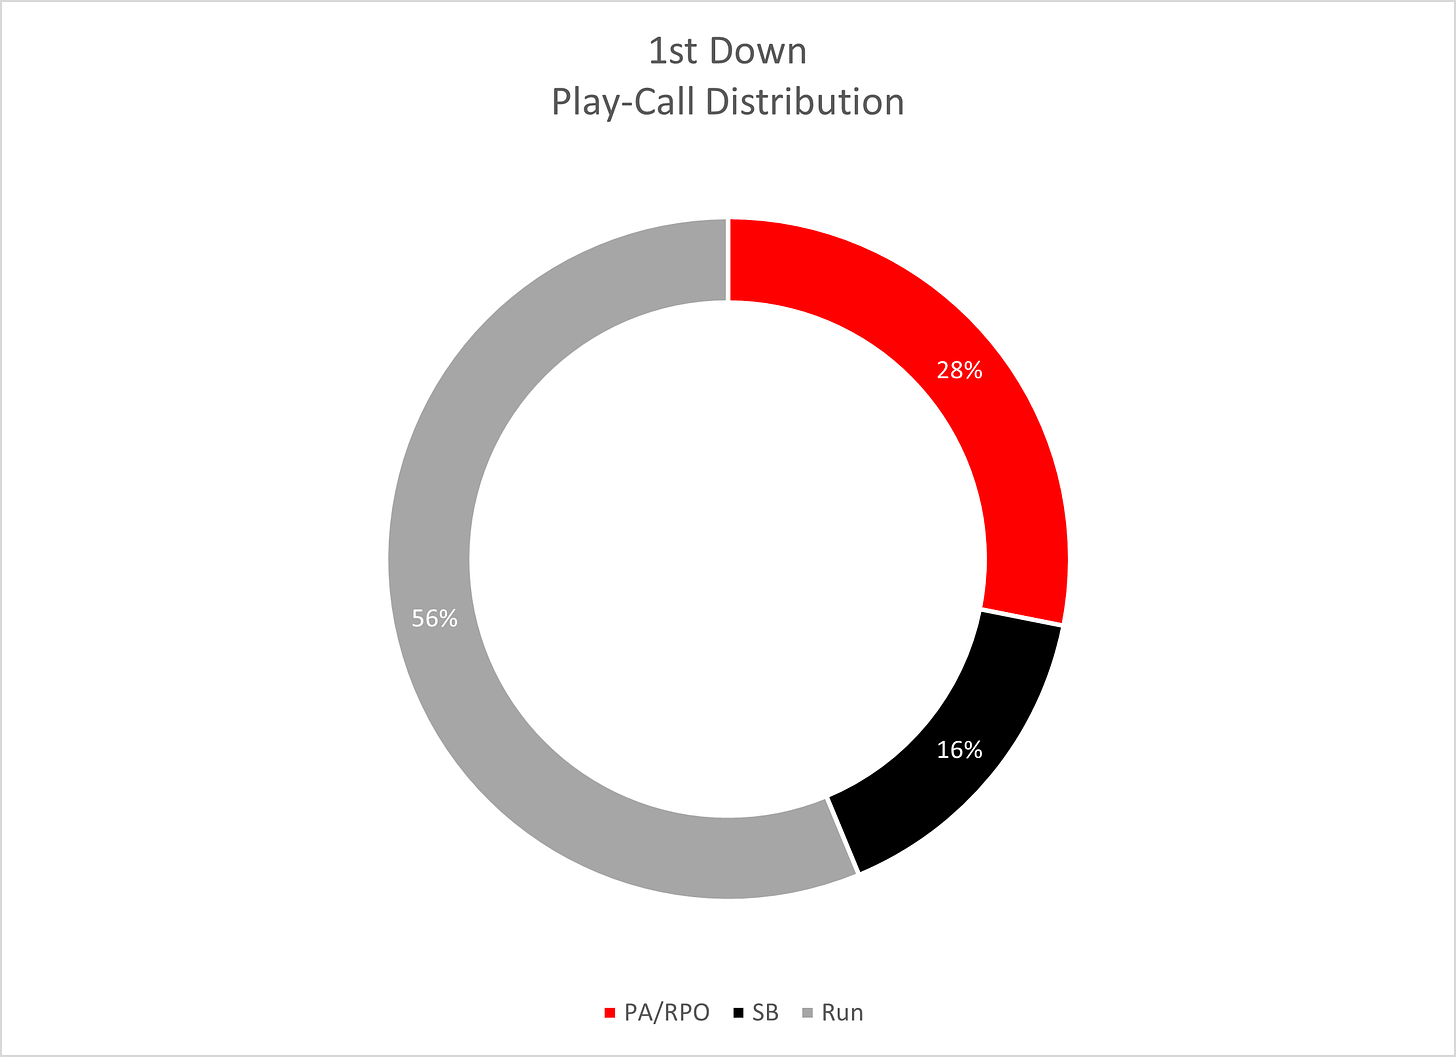
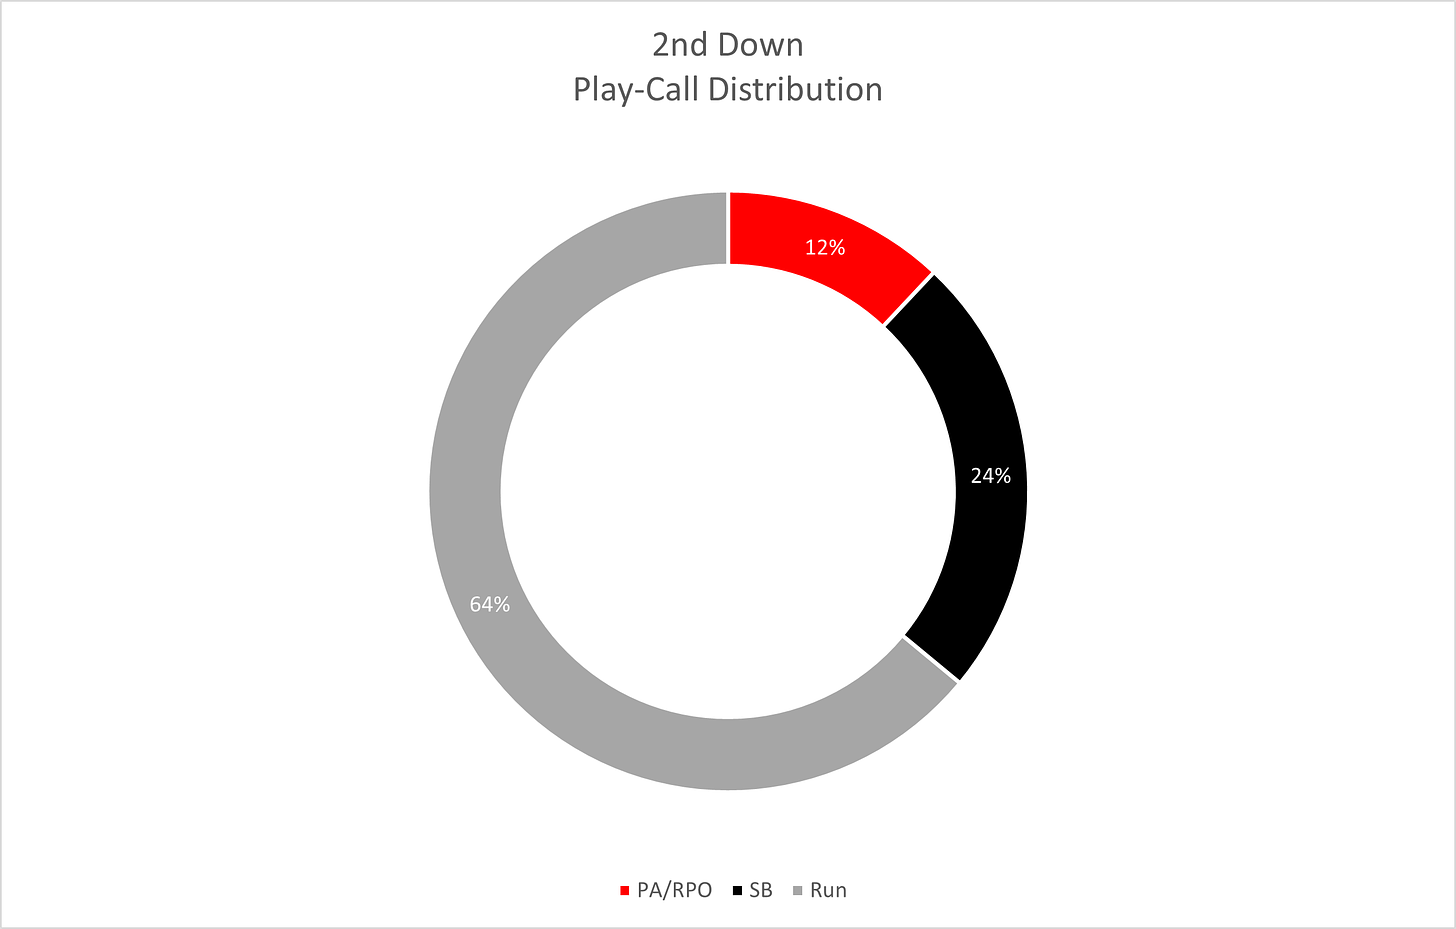
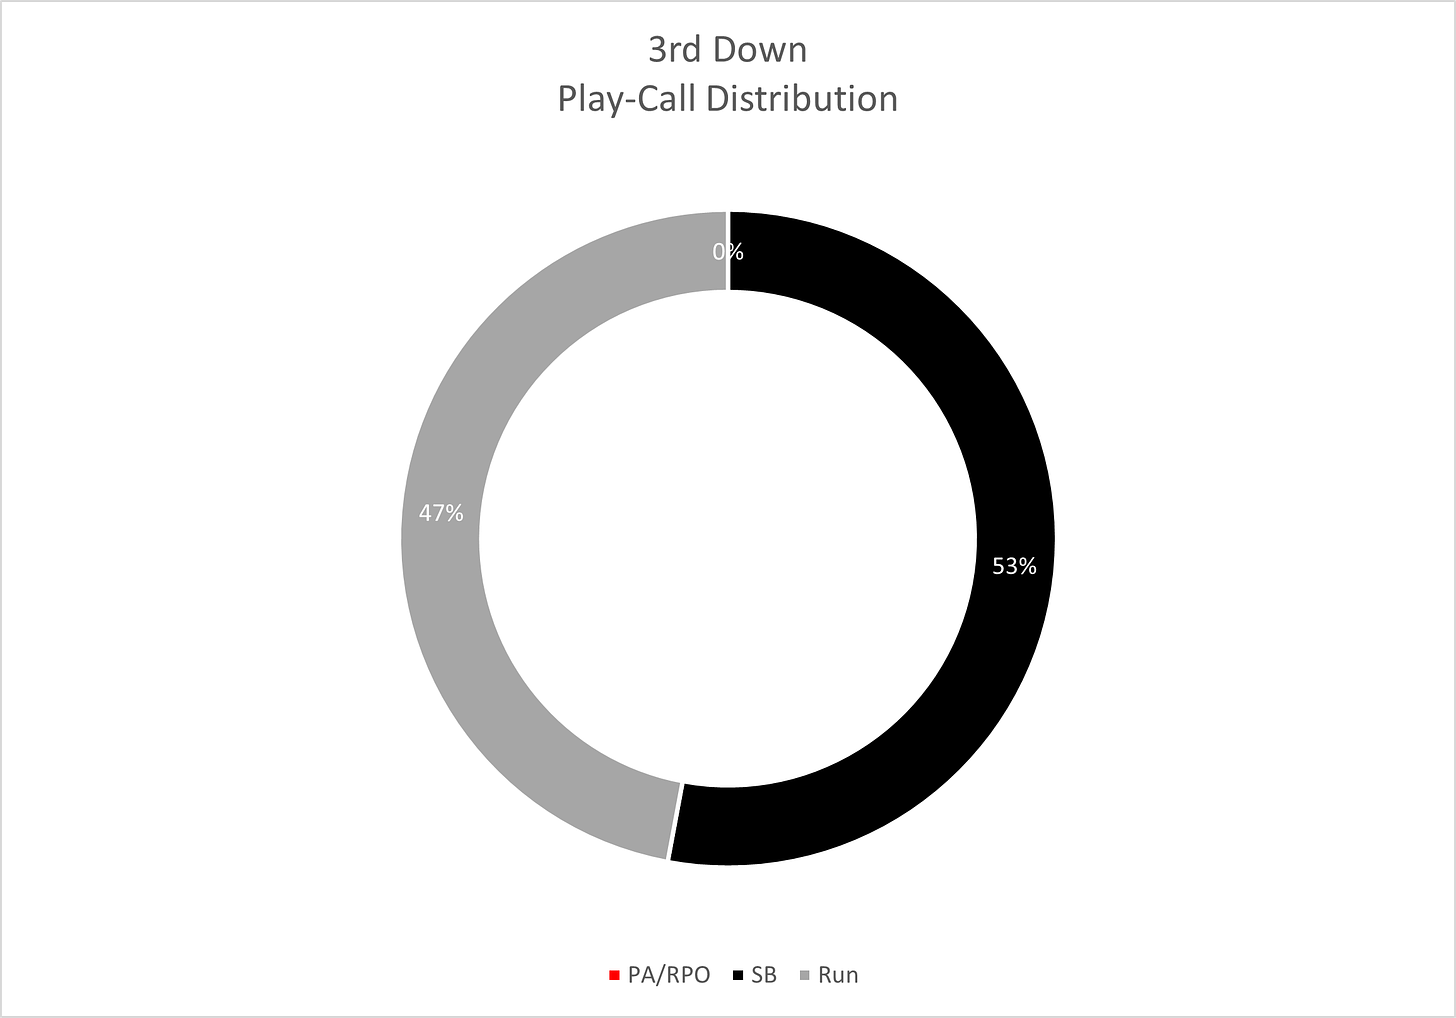
Play Calls:
We saw a good dose of PA/RPO Passes on 1st Down All Game…the execution of those plays was the struggle!!
On 2nd Down, we saw a flip in PA/RPO to Straight DB usage and a slight increase in Run Plays!
On 3rd Down, Phil Longo ditched the PA/RPO game and had a pretty even split between Run Plays & Straight Dropbacks!
EPA:
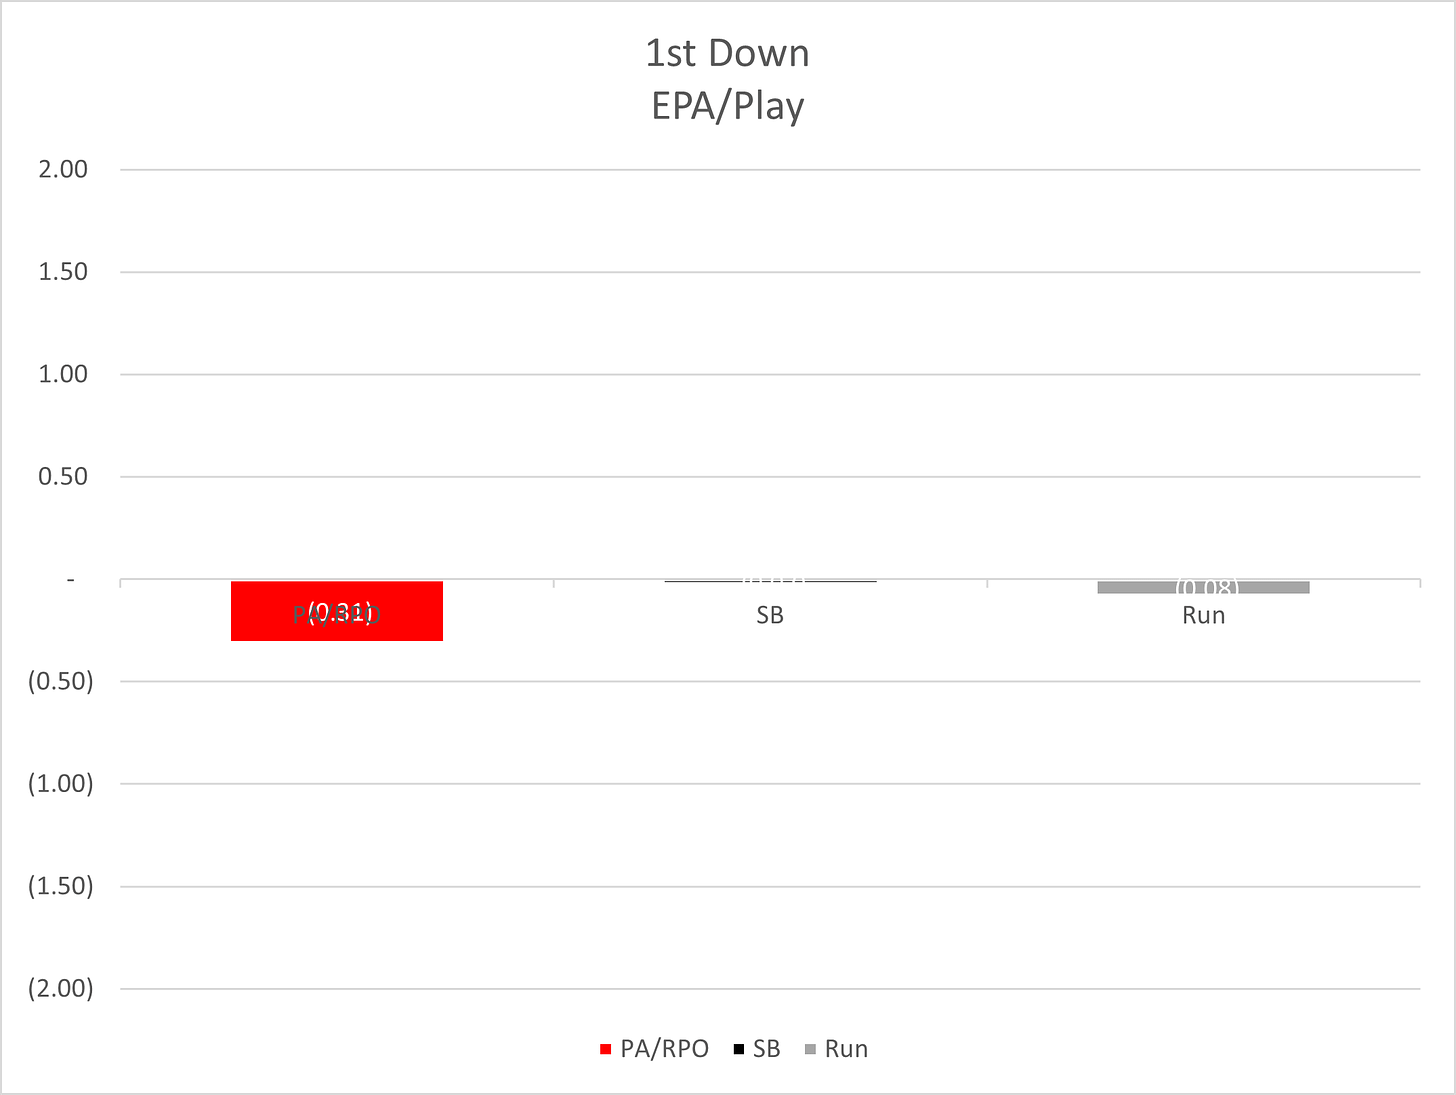
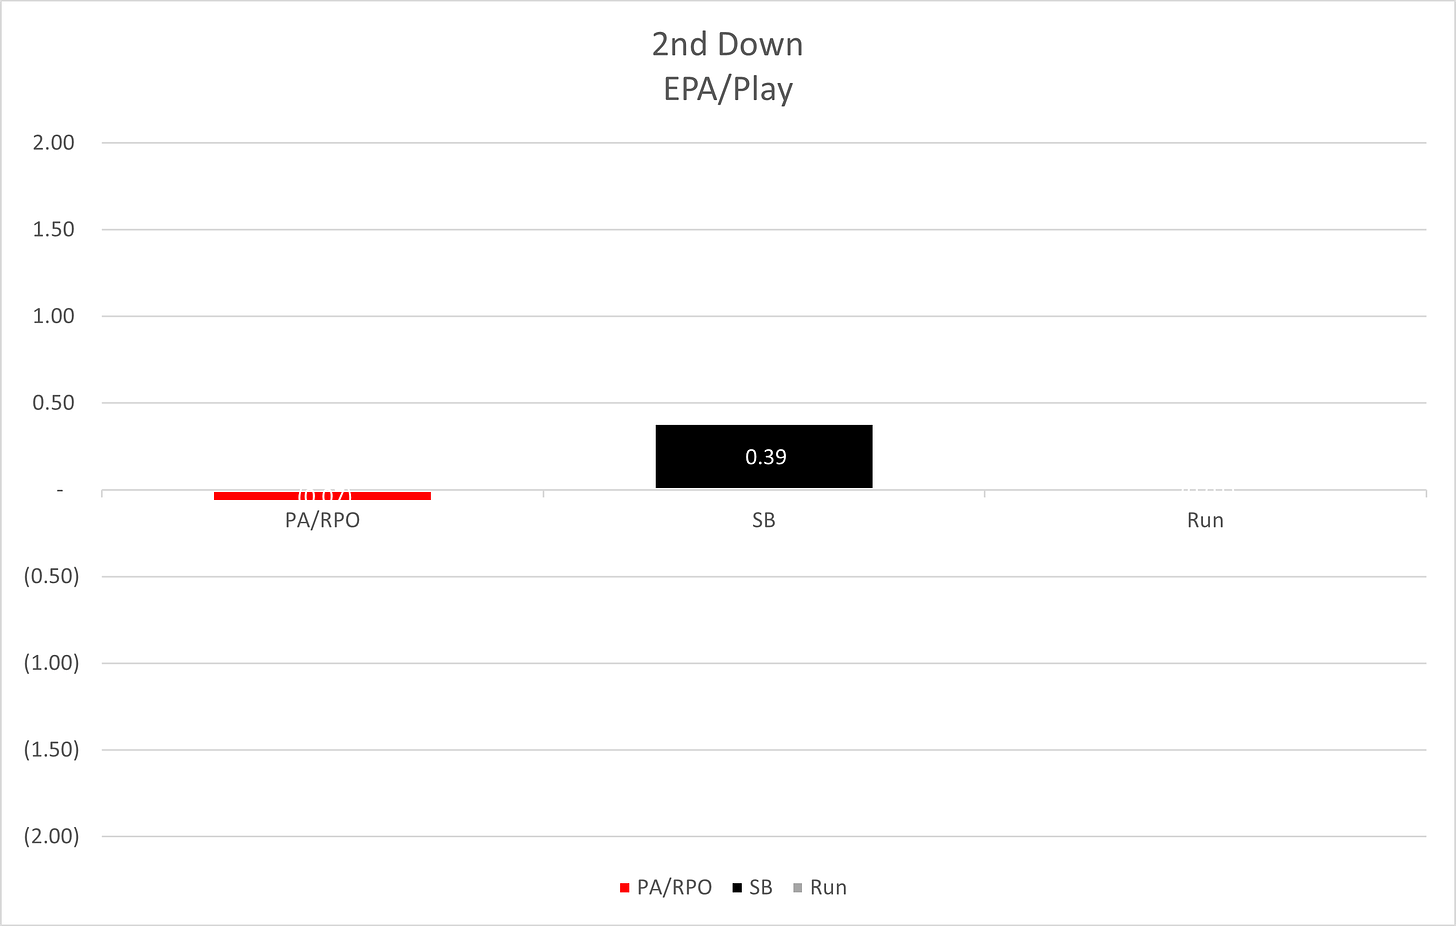
You can see on 1st Down no play was “successful” on an EPA/Play basis. On 2nd Down, the Wisconsin football passing game was much more impactful from an EPA basis than the Run-Game.
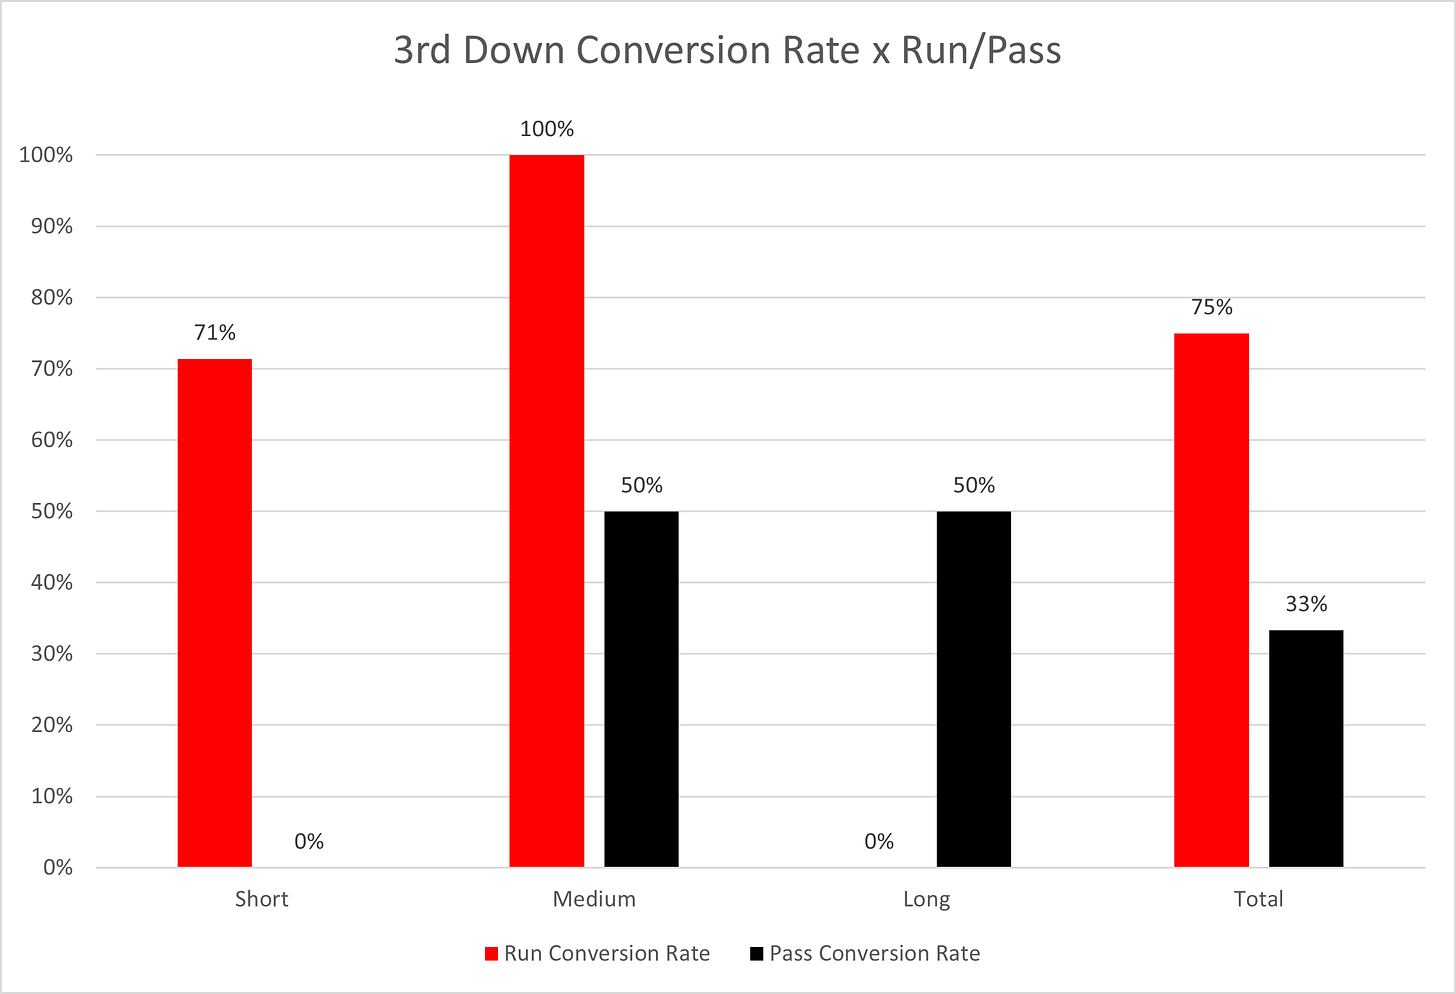
Our Run Plays on 3rd Down were the Most Successful from an EPA/Play basis. 5.67 EPA was generated on 3rd Down Run-Plays!!
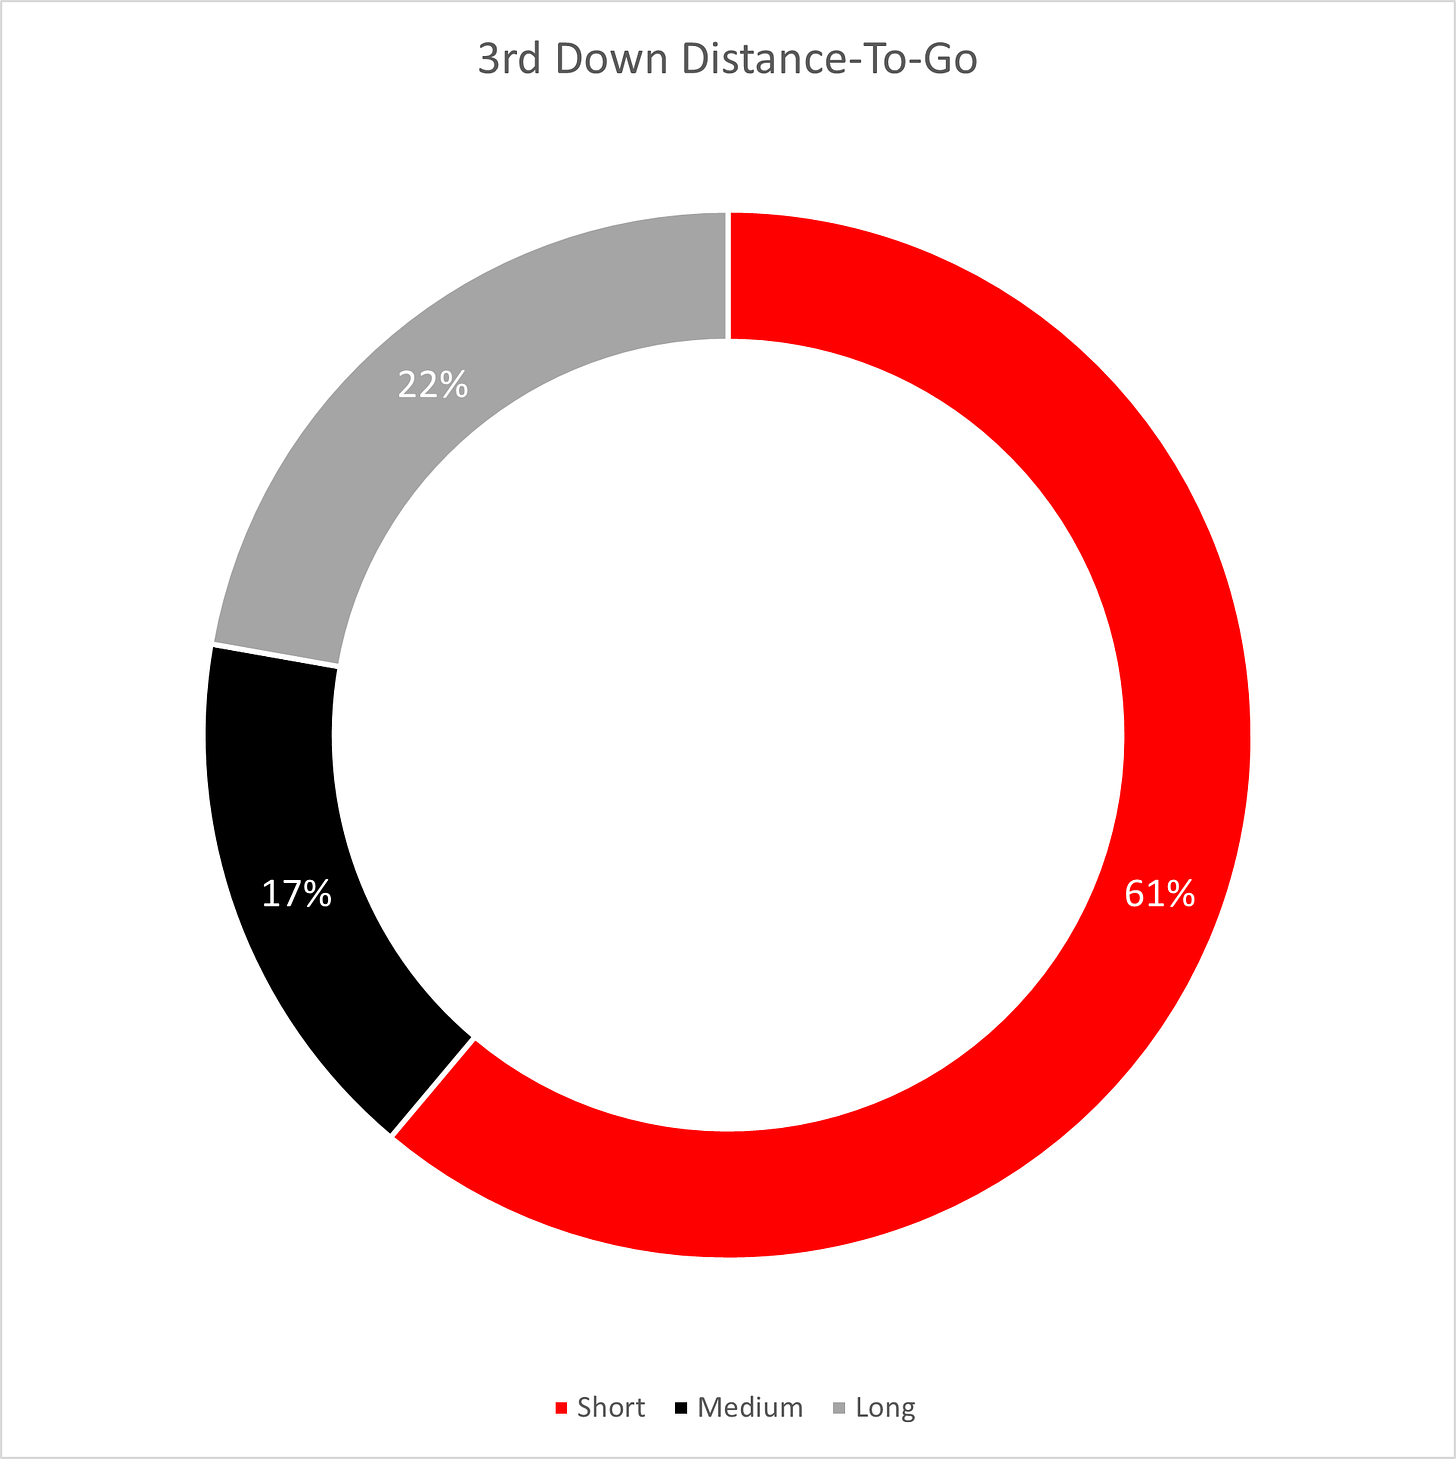
This is the 2nd Game in a row where we have been very good on 3rd Downs (53% Conversion) due largely to the many 3rd and “manageable” situations we left ourselves!!!
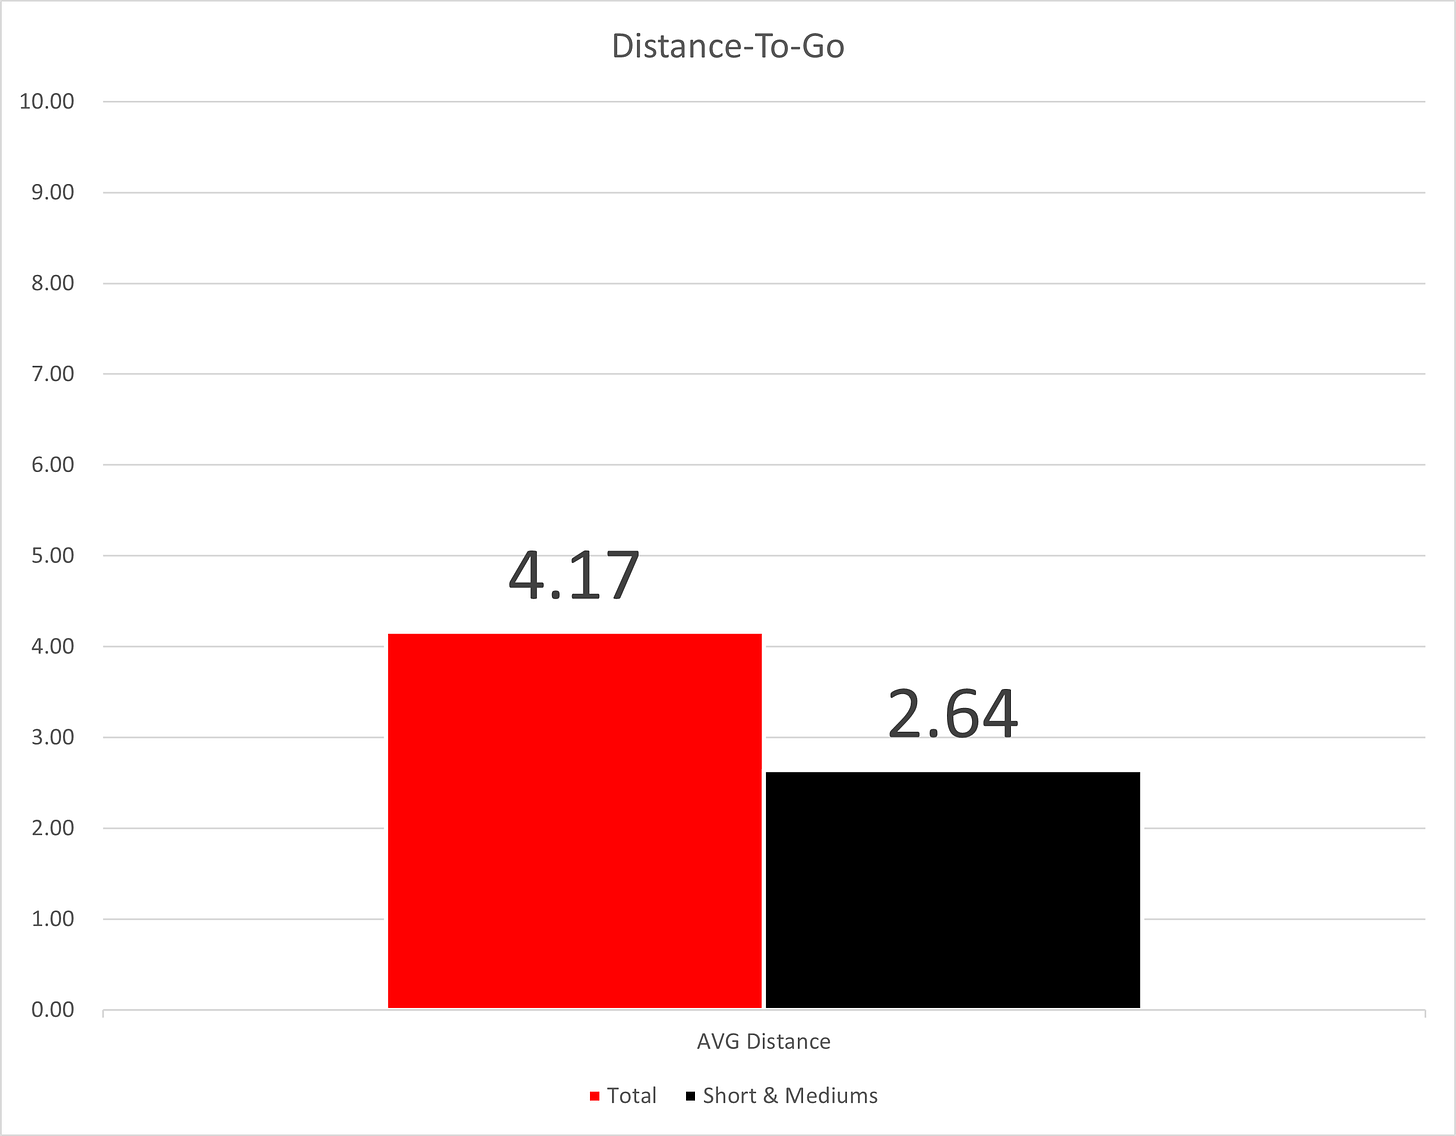
Over 78% in a “manageable” situation. So, when you average it out, you get 4.17 AVG Yards-To-Go. But in reality, 78% of the Badgers 3rd downs were in a very “manageable” position. When you average those situations, you get 2.64 AVG Yards-To-Go.
So it’s no wonder Wisconsin was so good on 3rd Down, which ultimately really helps your EPA/Play.
If you can recall from my EPA Primer, moving the chains and getting a fresh set of downs with a better field position is the whole idea of the EPA Model. And it gives you a general understanding of which plays & players add the most value to WINNING!!!
This is also why our RUN EPA on 3rd Down is so much higher. Because we saw most of our 3rd Downs in 3rd & Short Situations, we decided to run the ball, which the Wisconsin Badgers converted at a high clip.
Passing the ball on 3rd down, we struggled, converting only 33% of our opportunities!!
EPA/Play x Half & Game:
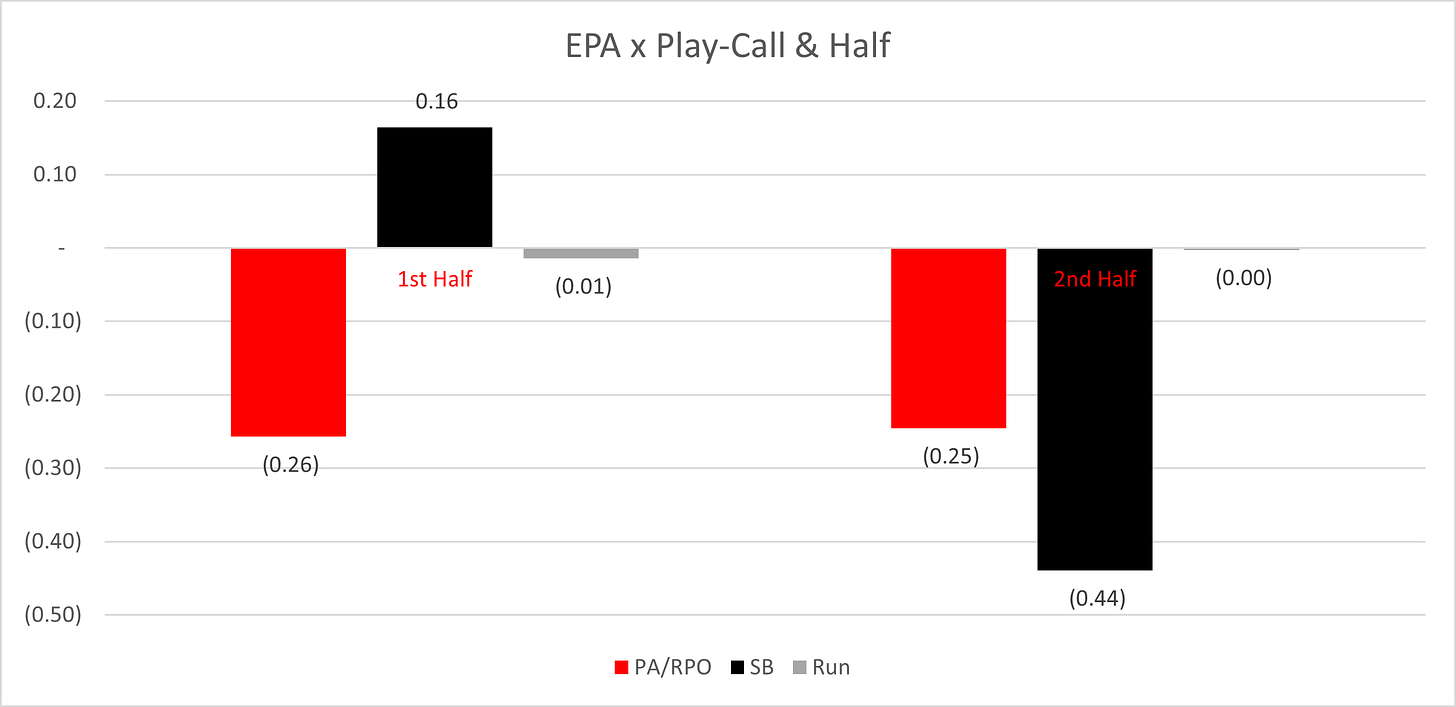
There is no other way to put it: Wisconsin football struggled in the PA/RPO game all day. Drops, errant throws via pressure, and lack of chunk plays really impacted these numbers.
Wait I thought you said our Run-Game was good. Why is our EPA negative???
Well, this is due to Braelon Allen & his 1H Fumble (-4.5 EPA) and the failed 4th Down Conversion from Jackson Acker (-4.29 EPA).
Our Straight DB Passing Game was a true bright spot, which, like the Run-Game, was severely impacted with Rucci’s Fumble late in the 4th Quarter.
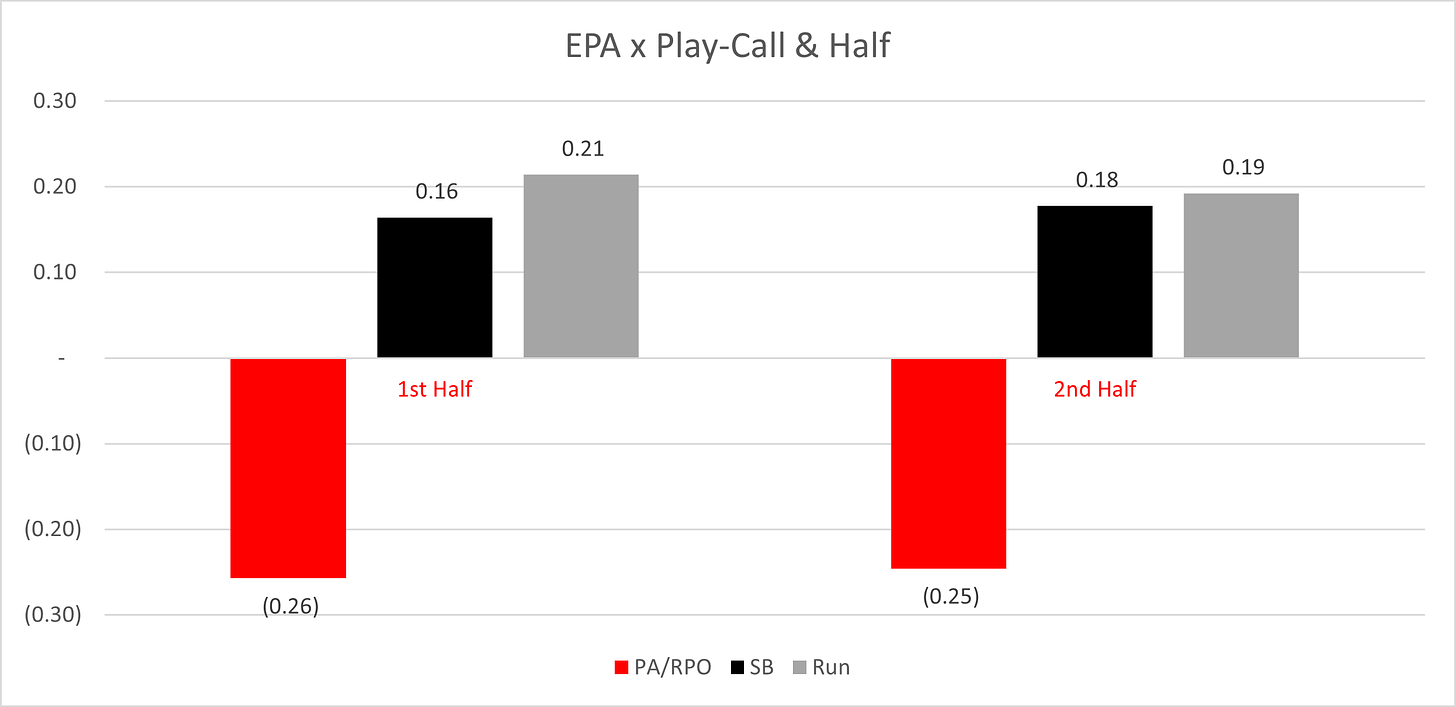
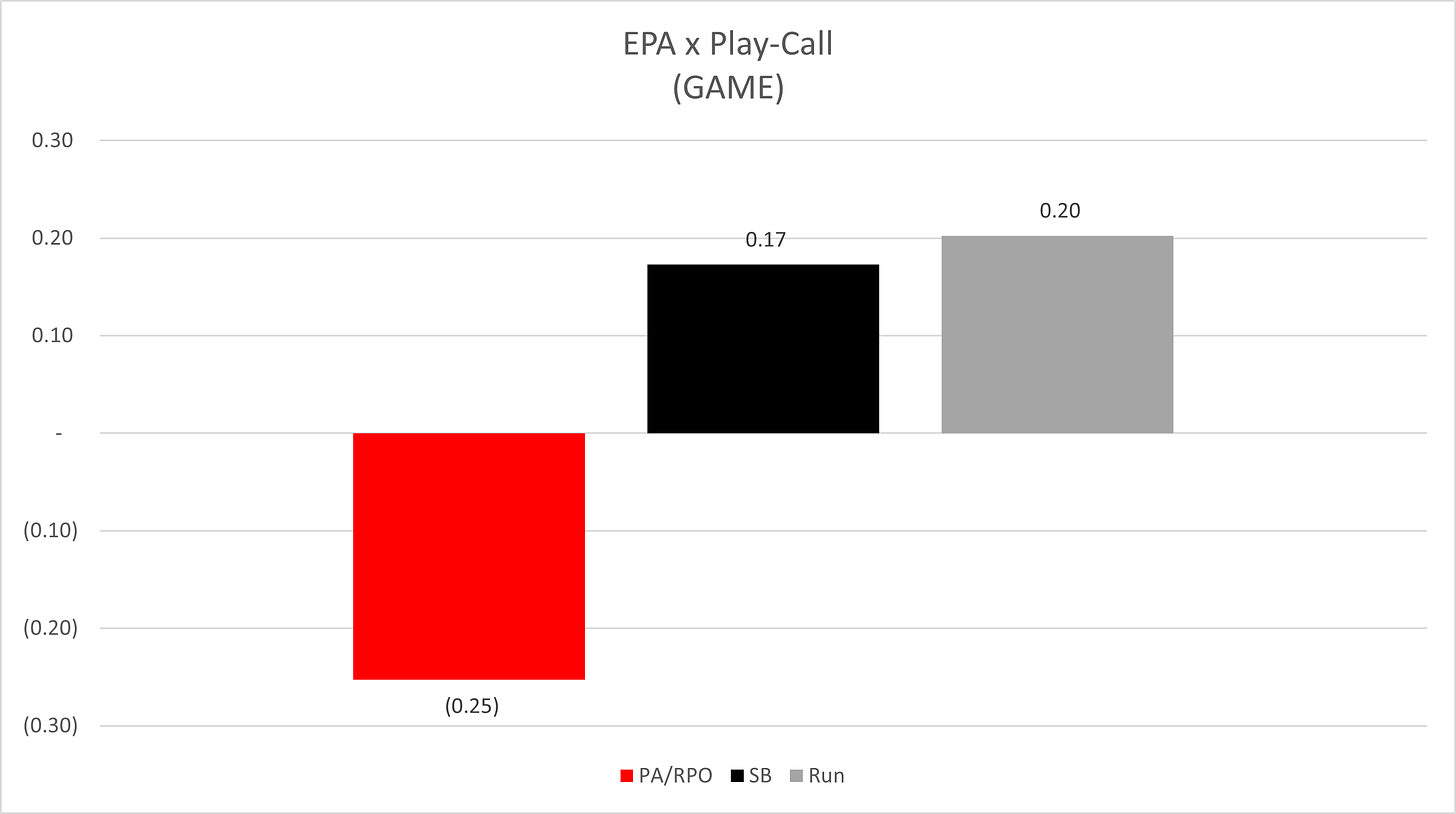
Here’s what these EPA numbers look like taking out these impactful plays!!
This was the story of yesterday’s game. The Badgers were really strong in a couple of areas. But the impact of a few plays really shifted the outcome of this game. There’s an interesting chart that gets shared weekly by a great CFB Analytics Guru on X/Twitter you can find him at statsowar, where he discusses an interesting topic.
“Did We Really Get Beat THAT BAD??”
Well, we beat the hell out of Rutgers. I’m using a different data source than he does, so there is a potential these could be different. But what he’s looking at is the Net Success Rate.
What is “Success Rate”?
50% of Yards To Go on 1st Down | Getting 2nd & 5 - OR BETTER
70% of Yards To Go on 2nd Down | Getting 3rd & - OR BETTER
3rd/4th Down is Converted
On Saturday, Wisconsin Football’s “Success Rate” was 55% to Rutgers' 33%.
That is a 22% Net Success Margin. Which would have been the 2nd Best Net Success Rate based on those Week 5 Matchups in his Graph.
So why didn’t the score reflect that?!?:
For reference, Michigan had a 34% Net Success Margin vs. Minnesota and won 52-10. Meanwhile, Ohio State had only a 5% Net Sucess Margin and won 37-17.
The Key Difference in their outperformance? Turnover Margin & Explosiveness
Wisconsin | -1 TO Margin
Michigan | +2 TO Margin
Ohio State | +2 TO Margin
Ultimately, we’re probably close to -10 due to the Turnover Margin!
We probably lost another -7 due to our drops (Explosiveness)
Wisconsin | 0.75 Explosiveness Rating
Michigan | 1.16 Explosiveness Rating
Ohio State | 1.34 Explosiveness Rating
I haven’t looked at any correlations between Scoring Margin and Net Success Rate, but that would probably be a great way to view how much we’re letting those explosive/detrimental plays impact us! My guess is we’re woefully underperforming our Net Sucess Rate!!!
Wisconsin Football EPA Leaders:
Tanner Mordecai (Passing):

